
Market Overview
Oil prices fell as Fed officials suggested it is too early to consider rate cuts, and an unexpected increase in U.S. gasoline stocks weighed on the market. Dallas Fed President Lorie Logan emphasized the need for flexibility in monetary policy, citing concerns about inflation.
U.S. crude oil inventories dropped by 4.2 million barrels, while gasoline stocks rose by 2 million barrels, defying expectations of a draw. Meanwhile, OPEC+ is negotiating to extend its production cuts into 2025.
These developments led to a bearish outlook for oil, impacting natural gas and oil forecasts with potential downward pressure on prices.
Natural Gas Price Forecast
 Natural Gas (NG) Price Chart
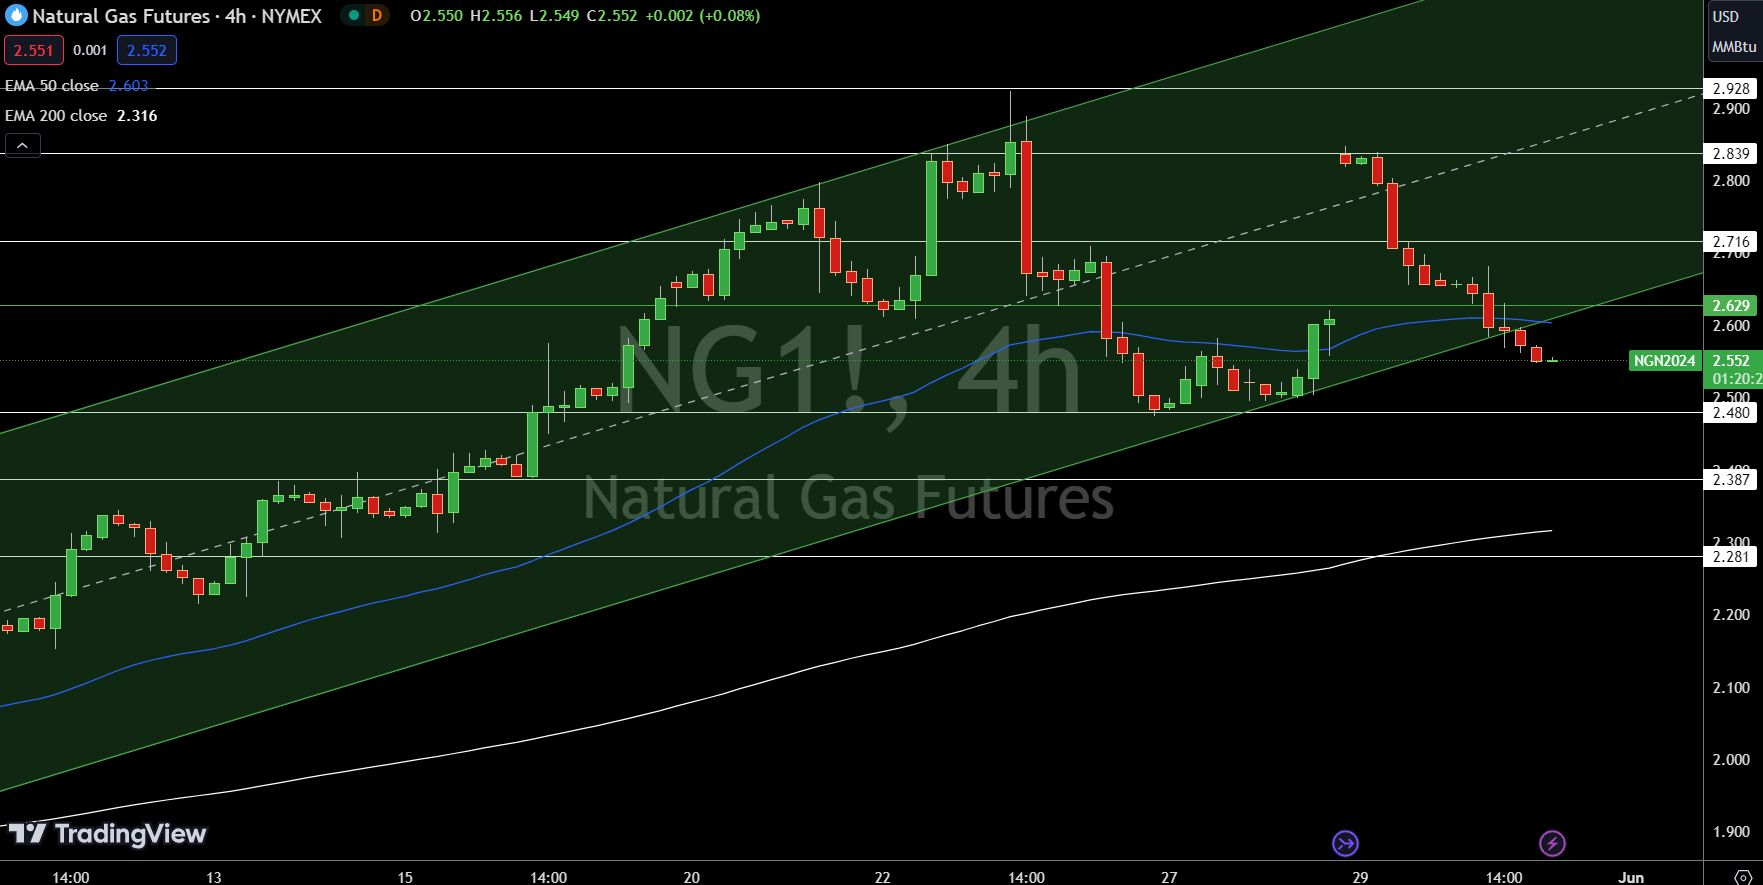
Natural Gas (NG) is currently priced at $2.552, down 0.07%. The pivot point, marked by the green line, stands at $2.63. Immediate resistance levels are at $2.72, followed by $2.84 and $2.93. On the downside, immediate support is at $2.48, with further support at $2.39 and $2.28.
The 50-day Exponential Moving Average (EMA) is $2.60, suggesting potential resistance, while the 200-day EMA is $2.32. The technical outlook for NG is bearish below the pivot point of $2.63.
A break above this level could shift the bias to bullish, targeting higher resistance levels. Conversely, staying below $2.63 may lead to testing lower support levels, maintaining downward pressure.
WTI Oil Price Forecast
 WTI Price Chart
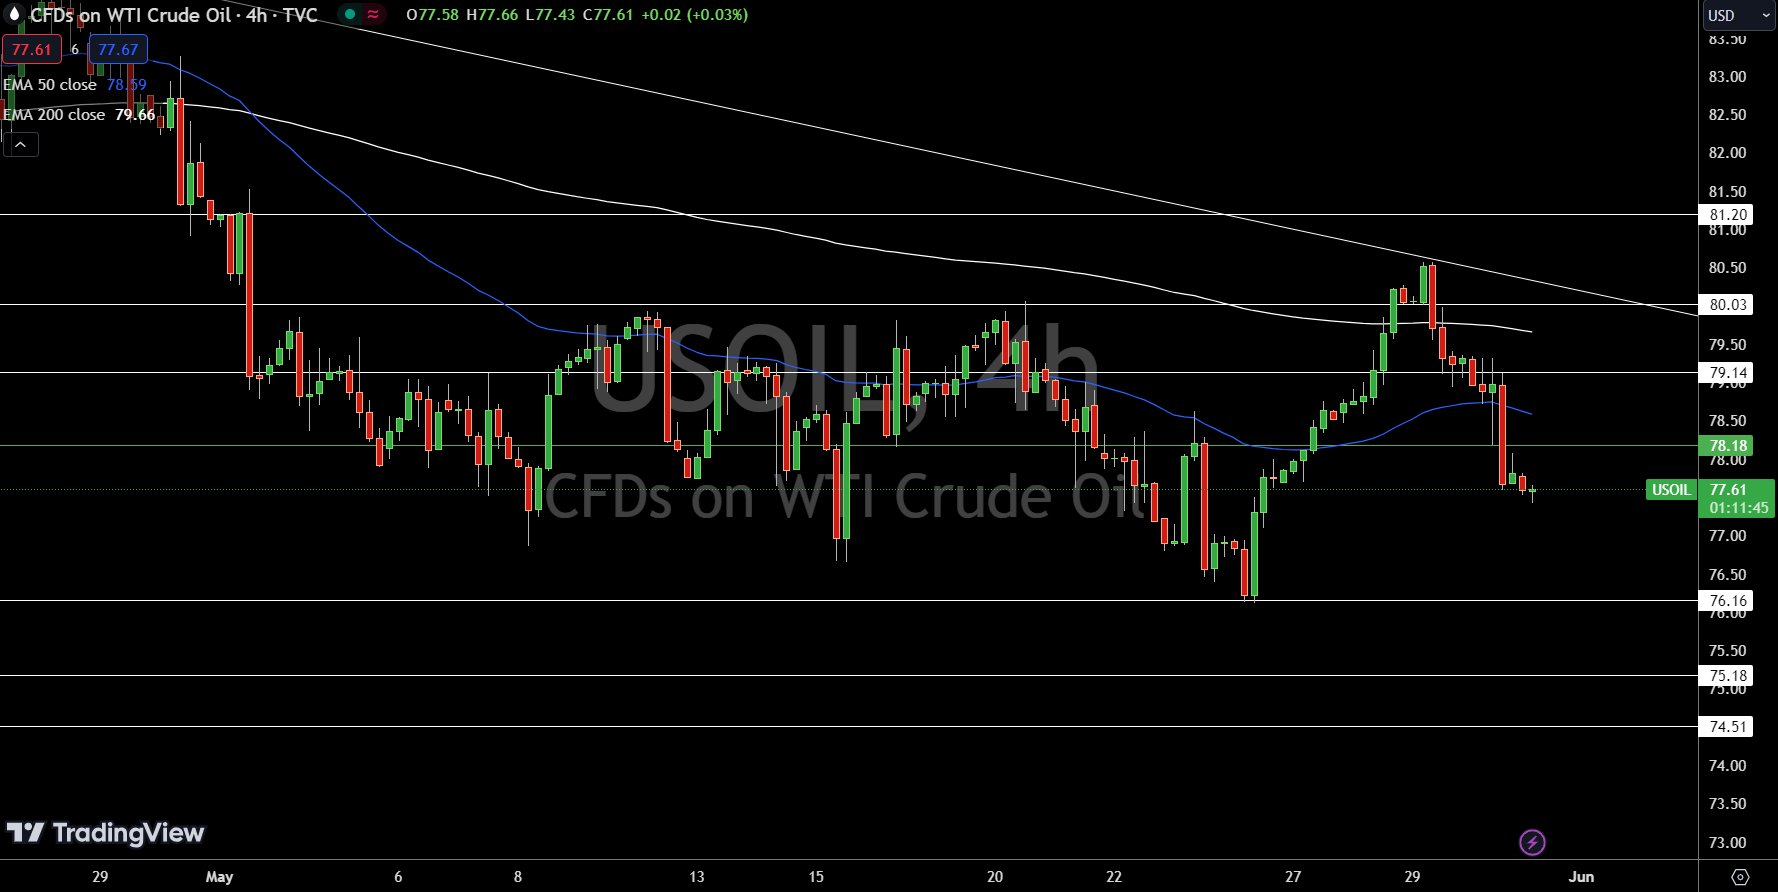
USOIL is currently priced at $77.61, down 0.23%. The pivot point, marked by the green line, stands at $78.18. Immediate resistance levels are at $79.14, followed by $80.03 and $81.20. On the downside, immediate support is at $76.16, with further supports at $75.18 and $74.51.
The 50-day Exponential Moving Average (EMA) is $78.59, indicating potential resistance, while the 200-day EMA is $79.66.
The current technical outlook is bearish below $78.18, with a break above this pivot point potentially shifting the bias to bullish. If prices fail to stay above $78.18, they may test lower support levels, suggesting continued downward pressure.
Brent Oil Price Forecast
 Brent Price Chart
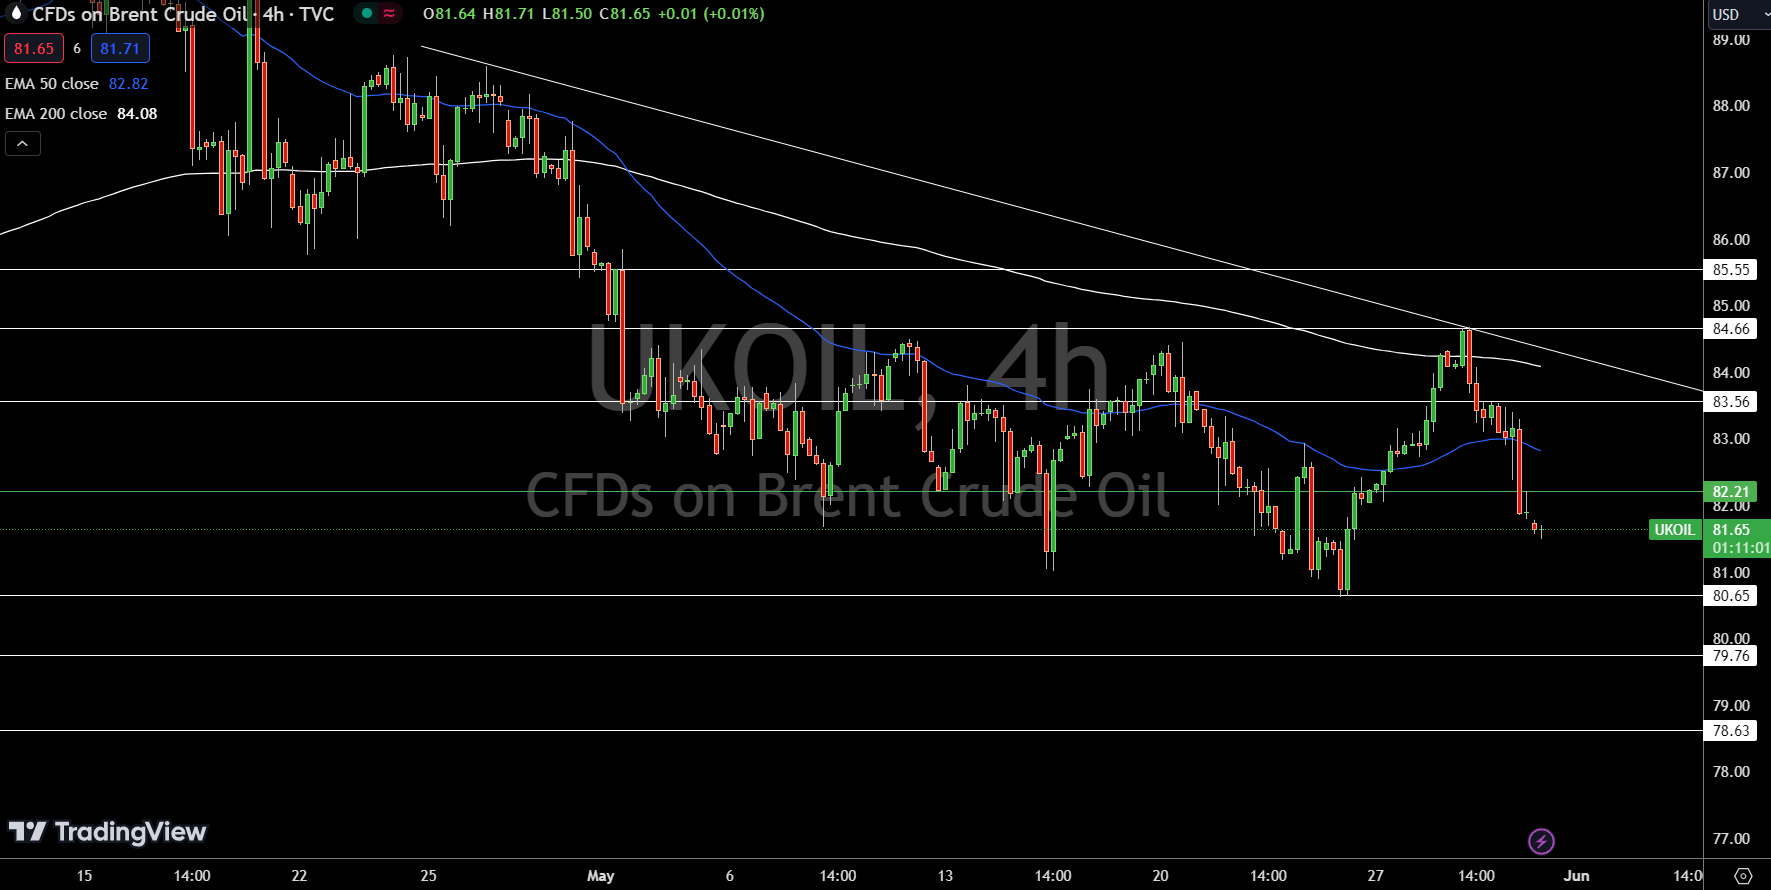
UKOIL is currently trading at $81.65, down 0.27%. The pivot point, marked by the green line, is at $82.21. Immediate resistance levels are at $83.56, followed by $84.66 and $85.55. On the downside, immediate support is at $80.65, with further supports at $79.76 and $78.63.
The 50-day Exponential Moving Average (EMA) is $82.82, indicating potential resistance, while the 200-day EMA is $84.08. The technical outlook for UKOIL is bearish below the pivot point of $82.21.
A break above this level could shift the bias to bullish, targeting higher resistance levels. Conversely, remaining below $82.21 may lead to testing lower support levels, maintaining downward pressure.
For a look at all of today’s economic events, check out our economic calendar.
This article was originally posted on FX Empire
More From FXEMPIRE:
- NASDAQ Weekly Price Forecast – NASDAQ 100 Continues to See Support
- Gold Weekly Price Forecast – Gold Continues to Work Off Froth
- Natural Gas, WTI Oil, Brent Oil Forecasts – Oil Markets Pull Back Ahead Of OPEC+ Meeting
The views and opinions expressed herein are the views and opinions of the author and do not necessarily reflect those of Nasdaq, Inc.

