

Fed cuts rates as expected but the details are more telling
- First rate cut since December 2024 & FOMC (and markets) expect another two in 2025. Market pricing of Fed funds target rate relatively more dovish through year end 2026, pushing stock-bond return correlations to their highest since April
- Easing financial conditions still underpinning equities & rate cuts around all-time highs historically bode well for equities going forward
- Alternatives benefit from elevated stock-bond correlations & a weaker USD
Summary
As expected, the Federal Reserve cemented that it is more focused on its employment mandate given labor market weakness, superseding inflation dynamics. With its first rate cut since December 2024 out of the way, the debate now shifts to whether the Fed will ultimately catch-down to the markets pricing in a more aggressive rate cutting trajectory relative to FOMC forecasts. More accommodative monetary policy layers into what had already been easing financial conditions which help to underpin risk-taking. Coupled with a strong corporate earnings complex driven by the AI secular theme and the expected benefits from fiscal stimulus via the tax legislation, equities have continued to set new highs. The Fed cutting rates around all-time highs in equities are relatively rare events. Yet history shows that equities perform positively on a go-forward basis.
One of the key risks for the markets is a deterioration in the fundamentals—e.g., if labor market weakness is a sign of a more nefarious slowdown in growth. As discussed in our prior piece, though, while the moderation in job growth has been notable, the slowdown in U.S. economic activity has been manageable. This is driven by a broadly resilient and dynamic services economy, and stable consumption. It remains a delicate balancing act between the real and market economies. However, the top-down and bottoms-up tailwinds generally remain in place for risk assets. For investors, the opportunity set has broadened across asset classes, themes, and regions. The challenge remains the search for diversification and uncorrelated returns—particularly given the higher stock-bond return correlations of the last five years. This trend has been borne out in 2025 with gold prices setting all-time absolute (over $3,700 a troy ounce) and inflation-adjusted highs, and strong inflows into digital asset ETFs such as the Nasdaq-listed iShares Bitcoin Trust (IBIT).
Biweekly Chart in Focus: Market pricing of Fed easing cycle has pushed equity-bond return 30-day correlations to their most positive since the early April tariff stresses

Source: Bloomberg.
Details
Fed vs. market pricing of easing cycle
The markets more aggressively pricing in a Fed easing cycle post Chair Powell’s Jackson Hole speech on August 22nd sent both equity and bond returns higher. As our Biweekly Chart in Focus above shows, the 30-day correlation between Nasdaq-100® daily returns and Treasury 10-year daily total returns has moved increasingly positive in September. The 30-day correlation reached nearly 50% around the September 17th FOMC meeting which marked the highest equity-bond return correlation since early 2025. We will revisit how investors are searching for other market diversifiers at the end given the positive equity-bond return correlations over the past five years.
Equity and bond markets’ reaction to the latest FOMC meeting was driven by the statement (tilted dovish), Powell’s emphasis on broader labor market weakness, and the characterization of the 25 basis point cut as “risk management”—another nod to the emphasis on its employment mandate. These more dovish points were juxtaposed by the FOMC’s latest quarterly Summary of Economic Projections (SEP) which tilted hawkish as the FOMC’s median “dot” showed another two cuts in 2025 but just one in 2026. By comparison, Fed funds futures pricing agrees with two more cuts this year but are portending up to three in 2026, for a terminal rate of around 3% (Figure 2). What is causing this divergence? The FOMC sees a pick-up in economic activity in 2026 (real GDP of 1.8% from 1.6% as of June), a slight decline in the unemployment rate (4.4% from 4.5%), and a corresponding increase in inflation (Core PCE of 2.6% from 2.4%).
Figure 2: FOMC’s median “dot” for year-end 2026 Fed rates vs. Fed funds futures pricing

Source: Bloomberg. Notes: FOMC median “dot” refers to the median forecast by the end of 2026 at each quarterly FOMC meeting when a new Summary of Economic Projections (SEP) was released
This divergence between the markets and Fed rate expectations is evident via other market-based gauges as well. Figure 3 shows the more Fed rate sensitive Treasury 2-year yield relative to the Fed funds rate. The bond market may still see the Fed rate as too restrictive given the employment weakness—Morgan Stanley notes that Treasury 2-year yields tend to lead Fed funds by 20 weeks. The spread between these two series had reached -100bps as recently as FOMC meeting day on September 17th. While we’ve seen this a handful of times the past few years post the Fed’s aggressive tightening cycle through 2023, historically, a -100 basis point spread tends to occur around recessions—implying that the markets see the Fed as needing to ease further as it is informed by lagged data.
Figure 3: Treasury 2-year yield pricing in a lower Fed funds target rate
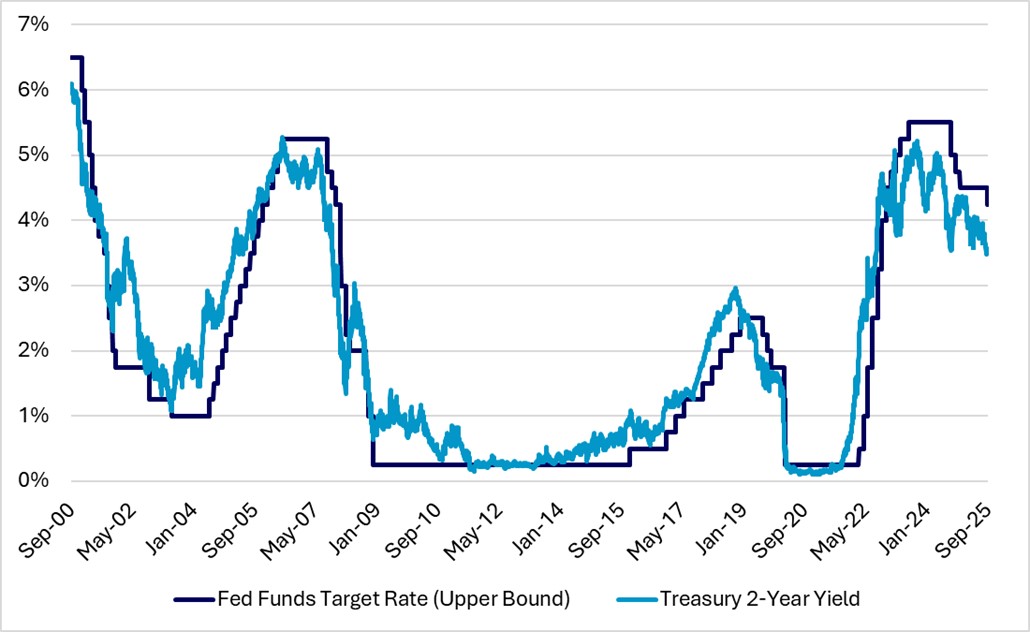
Source: Bloomberg.
Additionally, the nominal neutral Fed funds rate is estimated to be in the 3% to 3.25% range—100 basis points (or, four 25 basis point rate cuts) below where we are today. The real Fed funds rate (adjusted for inflation) is 1.6%. It has been in the 1.5% to 2.2% range YTD which is similar territory to where it was the past two recessions ex the Covid-19 period. Net-net: the Fed still has plenty of dry powder given its starting point. This is amidst worsening employment trends for those particularly impacted by higher borrowing rates and in lower income brackets such as the younger, 16 to 24 year old employment cohort and the unemployment rate for those considered underemployed (Figure 4).
Figure 4: Unemployment rates for younger cohort & the total rate for those underemployed at more than four-year highs

Source: Bloomberg. Notes: Part-time for economic reasons: People who are working part-time but would prefer and are available for full-time work. They often settled for part-time hours because their hours were cut back or because they could not find a full-time position. Marginally attached workers: People who want and are available for work and have looked for a job in the past 12 months, but have stopped looking in the last four weeks. The marginally attached group includes "discouraged workers," who stopped looking for work specifically because they believe no jobs are available for them.
Accommodative financial conditions continue to underpin risk assets
Per our July 18th piece, financial conditions are a key ingredient for investors deciding when to add or reduce risk. The more accommodative financial conditions have been a key pillar for equities setting new all-time highs. Bloomberg’s U.S. Financial Conditions Index—measuring financial stress across money, bond, and equity markets—has flashed looser financial conditions (>0) since early May following the tariff tantrum in April. This has brought the year-over-year trend to over 0 as well, which tends to match up directionally with equities (Figure 5).
Figure 5: Looser financial conditions have been a tailwind for equities
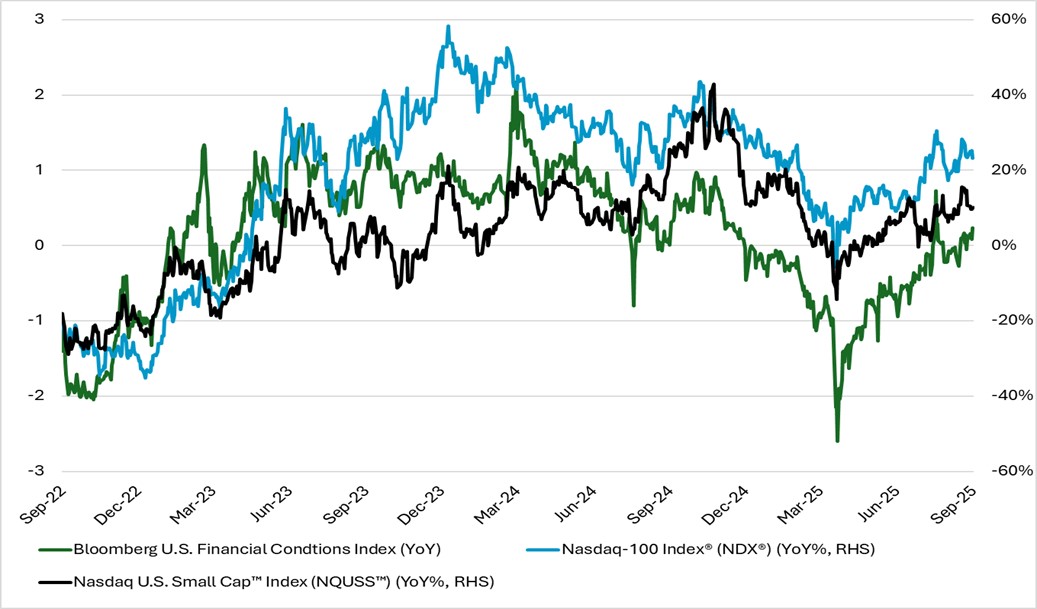
Source: Bloomberg. Notes: BFCIUS is a Z-score that indicates the number of standard deviations by which current financial conditions deviate from normal levels. Current reading in the time series is 0.56—greater than 0 are more accommodative/looser financial conditions. U.S. money market financial conditions consist of: TED Spread, Bloomberg 3mo Short Term Bank Yield Index/OIS spread, Commercial Paper/T-Bill spread. U.S. bond market financial conditions consist of: Baa/Treasury 10-year spread, U.S. High-Yield/ Treasury 10-year spread, U.S. Muni/Treasury 10-year spread, Swaption Vol Index. U.S. equity market financial conditions consist of: S&P 500 Index, VIX Index.
A more accommodative environment encourages greater risk-taking via:
- Lower discount rates which feed into how investors value future cash flows and help equity multiples expand;
- Lower cost of capital for companies (e.g., U.S. investment grade corporate debt spreads to Treasurys reached 72 basis points, lowest since early 1998 per Bloomberg) which can drive earnings and particularly benefits small caps as around 40% of Russell 2000 debt is floating rate debt (per J.P. Morgan Asset Management);
- Easier access to credit and liquidity which encourages investors to take more risk; and,
- A general boost to investor confidence via the wealth effect.
The Fed cutting rates when the S&P 500 has been within 1% of a record high has only occurred 16 times over the past 50 years according to Barclays Equities Tactical Strategies via Bloomberg. And this further easing in financial conditions has, historically, been beneficial for U.S. equities going forward. The mean and median 42-day forward returns were 1.9% and 2.9%, respectively, and equities have been positive over this time frame 81% of the time. Looking out over one year, equities have been positive 100% of the time.
Alternative asset classes can act as diversifiers amidst elevated stock-bond correlations & a weaker USD
U.S. dollar weakness has been driven by the well-known U.S. economic and fiscal policies coupled with the expected Fed easing cycle. Around the intensifying debate of the Fed’s independence, there has been increased talk of a “third mandate” for the Fed: an additional monetary policy objective to moderate long-term interest rates. While this will be open to the interpretation of the Federal Reserve Act and long-term rates are generally at the mercy of the markets (e.g., a larger drop in long-end yields likely need a notable deterioration in the economic outlook), investors have nevertheless taken this as another signal of the Trump administration’s push for lower rates. This has further added to USD bearish positioning as CFTC USD speculative net short positioning is at its highest since February 2021.
Aside from the dynamic of increased USD hedging, investors have looked for other macro hedges and diversifiers. Beneficiaries amidst the aforementioned elevated stock-bond return correlations and the weaker USD have been gold and digital assets. Per Figure 6, cumulative digital asset ETF net flows have overtaken gold ETF flows alongside the rise in the price of Bitcoin. This has pushed IBIT to reach nearly $86 billion in assets under management—making it the 7th largest iShares product by assets despite only having launched in January 2024.
Figure 6

Source: J.P. Morgan Asset Management
The demand for digital assets as a standalone asset class has culminated in Nasdaq’s recent announcement that we have submitted a filing to the SEC to facilitate the trading of tokenized securities on the Nasdaq Stock Market® trading as regular securities. See here for more information on Nasdaq’s digital asset initiatives. Elsewhere, investors are increasingly searching for exposure in private markets as a diversification source for total portfolios —please see the annual Nasdaq eVestment Private Markets Fund Trends Report for more details on key themes and commitment activity. As lines further blur between public and private markets, and as more partnerships materialize, private market and alternative offerings will likely only increase their clout in total portfolios.
Disclaimer:
Nasdaq®, Nasdaq-100®, and Nasdaq Stock Market® are registered trademarks of Nasdaq, Inc. The information contained above is provided for informational and educational purposes only, and nothing contained herein should be construed as investment advice, either on behalf of a particular security or an overall investment strategy. Neither Nasdaq, Inc. nor any of its affiliates makes any recommendation to buy or sell any security or any representation about the financial condition of any company. Statements regarding Nasdaq-listed companies or Nasdaq proprietary indexes are not guarantees of future performance. Actual results may differ materially from those expressed or implied. Past performance is not indicative of future results. Investors should undertake their own due diligence and carefully evaluate companies before investing.
ADVICE FROM A SECURITIES PROFESSIONAL IS STRONGLY ADVISED.
© 2025. Nasdaq, Inc. All Rights Reserved.
Latest articles

This data feed is not available at this time.
Data is currently not available