

Key Points:
- Favorable financial conditions underpinning equities
- Recent string of U.S. economic data has taken the Citi Economic Surprise Index back into positive territory which has helped broaden the YTD equity rally
- Fundamentals in focus as Q2 earnings season kicks off amidst the cacophony out of Washington
Summary
As the markets look to the next trade negotiations deadline of August 1st, a byproduct of the de-escalation of the broader trade conflict has been a reduction in financial market stress indicators. Tighter financial conditions make the cost of capital for companies and investors alike more expensive and vice versa. A measure of U.S. financial conditions hit its most restrictive since June 2020 in early April 2025. Since then, as money, bond, and equity market stress measures eased, so too have broader financial conditions—alleviating the cost of capital and underpinning risk assets which have increasingly looked through the constant noise out of Washington. There are signs of a broadening in the equity rally amidst elevated absolute and relative U.S. valuations heading into Q2 earnings period as U.S. economic data has surprised to the upside and business and consumer sentiment has improved.
Biweekly Chart in Focus: Financial Condition Trends Inform Risk-Taking

Source: Bloomberg. Notes: BFCIUS is a Z-score that indicates the number of standard deviations by which current financial conditions deviate from normal levels. Current reading in the time series is 0.56—greater than 0 are more accommodative/looser financial conditions. U.S. money market financial conditions consist of: TED Spread, Bloomberg 3mo Short Term Bank Yield Index/OIS spread, Commercial Paper/T-Bill spread. U.S. bond market financial conditions consist of: Baa/Treasury 10-year spread, U.S. High-Yield/ Treasury 10-year spread, U.S. Muni/Treasury 10-year spread, Swaption Vol Index. U.S. equity market financial conditions consist of: S&P 500 Index, VIX Index
Details
Important to Employ a Holistic View for Risk-Taking
The deep equity sell-off in early April in reaction to the U.S.’s “Liberation Day” trade tariff announcement was the headlines’ focus. However, it was likely concerns around the increase in Treasury 10-year yields despite the risk-off backdrop which contributed to the announcement of a 90-day tariff pause (which has been extended, again, until August 1st). The markets concurrently sent signals of stress via other assets with the spread of U.S. corporate high yield to Treasury 10-year yields spiking to 18-month highs.
Unsurprisingly, Bloomberg’s U.S. Financial Conditions Index—measuring financial stress across money, bond, and equity markets—turned extremely restrictive in April and the tightest since the Covid-19 period in early-and-mid 2020. Given the walking back by Washington of the most punitive trade policies and as the markets’ reaction to trade tariff headlines has faded overtime, financial conditions have, in turn, responded by shifting to more accommodative levels. Bloomberg’s U.S. Financial Conditions Index is back to its most accommodative since the end of February when equity markets began to sell-off from their then all-time highs on February 19th.
As shown in the chart above, accommodative financial conditions are a key ingredient for investors deciding when to add or reduce risk. The recent loosening has played an important role in equities setting new all-time highs. It is imperative for investors to watch corporate credit spreads as a barometer for corporate sentiment and Treasury 10-year yields as equities have tended to hit a near-term ceiling recently when yields rise into the 4.60% area. Treasury 10-year yields have risen by over 20 basis points since the end of June to approximately 4.45% on the passage of the tax cut extension and spending legislation, resilient U.S. economic data (more below), and moderating but stickier inflation trends. Additionally, fiscal spending concerns outside of the U.S. as well have led to a gravitational pull from longer-dated international government bonds. For example, Japanese 20-year bond yields hit their highest since 2000 on concerns about fiscal spending levels ahead of Upper House elections.
Resilient U.S. Economy & Improved Sentiment Helping with a Broadening of Equity Rally
As we noted in our June 20th Biweekly Investment Insights, for a broadening out to sustain in the more economically sensitive small cap space, investors will need to be convinced of a reacceleration in economic and business activity. As a very near-term proxy of U.S. economic momentum, while volatile, Citi’s U.S. Economic Surprise Index has moved back to over 0—indicating more positive than negative economic data surprises relative to estimates. This rebound has been driven by a spike in soft economic data surprises as that index is at its highest since early December 2024 as consumer and business confidence has improved on account of the de-escalation of the trade wars. The recent passage of the tax and spending bill also added to the relative improvement in the U.S. economic outlook. As such, the iShares Russell 2000 ETF (IWM) has slightly outperformed the Vanguard S&P 500 ETF (VOO) by nearly 1% since the April 8th lows.
Investors have grown accustomed to the mega-cap tech names leading index returns on account of these companies being at the forefront of the AI revolution and amongst the highest quality names in the world (see further below). Yet amidst the macro volatility there is room for micro-opportunities. Consequently, a broadening of the equity rally will be a healthy backdrop for the markets and continue to present opportunities for generating alpha for clients.
The Nasdaq-100 Mega Index™ (NDXMEGA™), which targets the performance of the top 45% cumulative weight of the Nasdaq-100, has returned over 44% from the April 8th lows versus 34% for the Nasdaq-100 and 26% for the S&P 500—indicating a more concentrated rally. However, the Nasdaq-100 Mega™ cohort has underperformed the Nasdaq-100 on a year-to-date basis (6.4% versus 9%) and is in-line with the 6.5% return for the S&P 500 as the rally has broadened to other areas as well. For example:
- Industrials are the top performing S&P 500 sector YTD, higher by 14%, benefiting from the administration’s domestic infrastructure agenda.
- Utilities have also outperformed the broader benchmark, up by over 8% YTD, as they have benefited from the power usage required for the AI ecosystem and could further benefit from U.S. domestic energy policies.
- Financials have slightly outperformed—higher by almost 8% YTD—on the prospects of a rebound in lending activity against the backdrop of a resilient U.S. economy and lower Federal Reserve rates going forward. (This performance spread had been wider. However, State Street, BlackRock, and Wells Fargo were all lower between 5.5% and 7.3% post Q2 earnings reports on July 15th.) More recently, deregulation has been a tailwind, particularly for the larger money center and regional banks—e.g., the KBW Nasdaq Bank Index™ (BKX™) is up by over 10% YTD.
Q2 Earnings Begin in Earnest as Markets Have Increasingly Looked Through Trade Policy Volatility
The most notable broadening of equity returns has been on a global basis as international equities continue to outperform the U.S.: MSCI ACWI ex-US is up by over 15% YTD vs. 6.6% for MSCI U.S. As also discussed in our prior piece, U.S. equities are headed into Q2 earnings season at lofty absolute and relative valuations: MSCI U.S.’s next twelve months price-to-earnings (P/E) ratio stands at a 45% premium relative to MSCI Europe ex-UK. While that is notably above the median of a 17% premium since January 2006, it is below the peak of 58% in early November 2024.
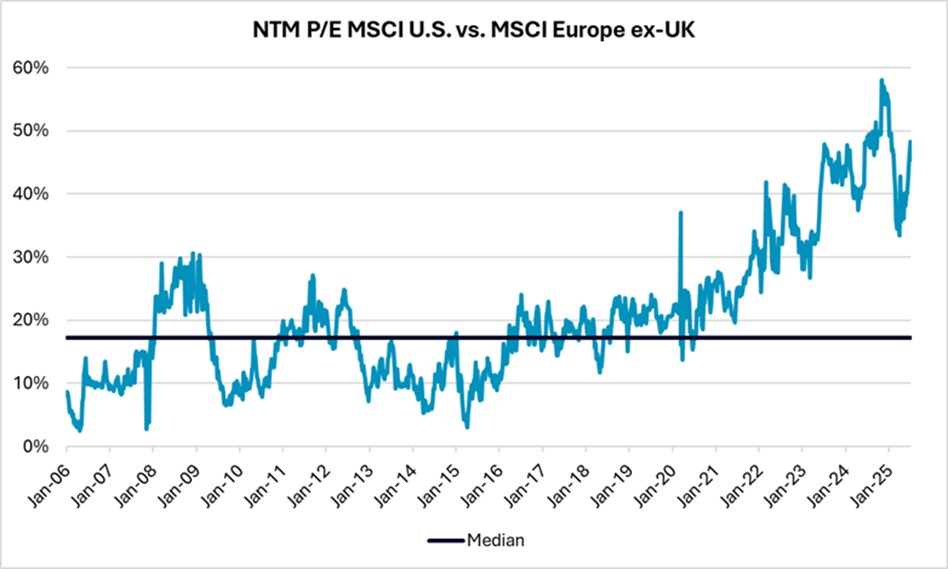
Source: Bloomberg
These valuation premiums have largely been justified given the AI theme has been best exemplified by high-quality U.S. companies (see here for a recent piece from Nasdaq Index Research on AI adoption trends and here for other research, including earnings-related insights).
As a proxy for “quality”, via DataTrek Research and Bloomberg data, the average return on equity (ROE) across the five largest U.S. companies (Nvidia, Microsoft, Apple, Amazon, Alphabet) is 69.4%—more than double the 30.4% average of the five largest international companies (Taiwan Semiconductor, Tencent, SAP, ASML, Nestle). As Q2 earnings season rolls in, investors will take cues from corporate reporting and guidance to inform their views of the impact of persisting uncertainties.
Disclaimer:
Nasdaq® is a registered trademark of Nasdaq, Inc. The information contained above is provided for informational and educational purposes only, and nothing contained herein should be construed as investment advice, either on behalf of a particular security or an overall investment strategy. Neither Nasdaq, Inc. nor any of its affiliates makes any recommendation to buy or sell any security or any representation about the financial condition of any company. Statements regarding Nasdaq-listed companies or Nasdaq proprietary indexes are not guarantees of future performance. Actual results may differ materially from those expressed or implied. Past performance is not indicative of future results. Investors should undertake their own due diligence and carefully evaluate companies before investing.
ADVICE FROM A SECURITIES PROFESSIONAL IS STRONGLY ADVISED.
© 2025. Nasdaq, Inc. All Rights Reserved.
Latest articles

This data feed is not available at this time.
Data is currently not available