
What to Know About the Annual Russell Index Changes
We know from prior research that index rebalance dates create unusually large close volumes.
On Friday, we will see the annual Russell reconstitution. It’s typically the biggest close of the year (Chart 1, blue dots), especially given it does not coincide with a triple witch date like the S&P rebalances.
This year, brokers estimate more than $100 billion will trade during the 2023 Russell reconstitution. According to Russell, there are 33 companies expected to be added to the Russell 1000 and 297 companies joining the Russell 2000.
Chart 1: Closing auctions are much larger on index rebalance dates
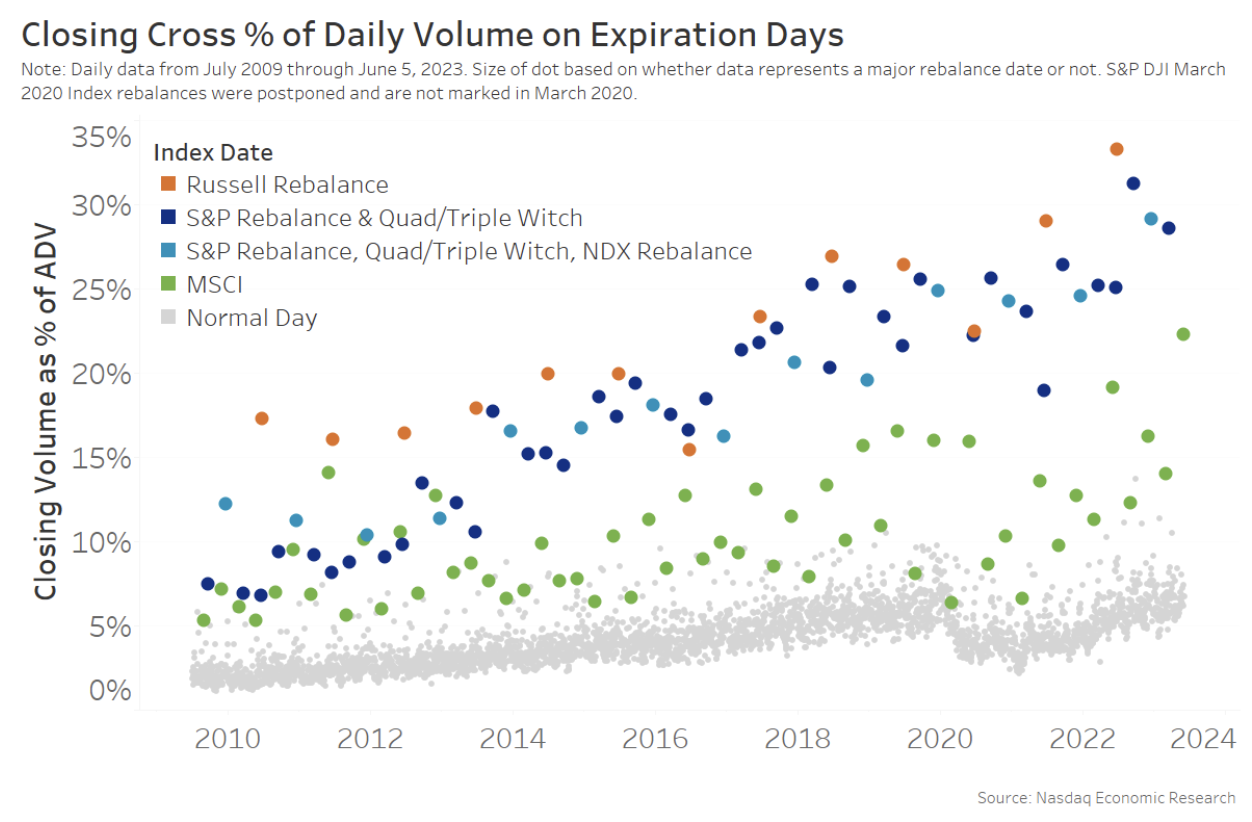
On a regular trading day, company stocks trade around $370 billion. However, the close is usually only about $25 billion (7% of value) and around 500 million shares (5% of volume) traded.
Although the close had been increasing persistently since before 2010, we saw it decline during Covid to about 3% of market volume as investors focused on overnight news about the Pandemic. However, the uptrend appears to have re-established itself as Covid cases fell.
But as the colored dots show, index rebalance days are different.
The close is far more active and is becoming larger as index funds become more popular. The Russell reconstitution (blue dots) has increased from around 12% of ADV in 2011 to more than 25% of ADV in the past two years. In fact, we estimate the nine dates each year with index rebalances (4 x S&P, FTSE (and Nasdaq-100 in December) + 4 x MSCI + 1 x Russell) to add to about $500 billion in additional close trading.
Why do index funds mostly trade in the close?
Index funds aren’t like traditional active mutual funds.
Traditional active mutual funds pick stocks that are expected to outperform. They then trade them as secretly as possible in order to keep as much outperformance as they can. At the end of the year, they are primarily measured by how much they beat the market return. Said another way, they are trying to maximize alpha.
In contrast, index funds are primarily measured by how closely they match the market return. Said another way, they are trying to minimize tracking error.
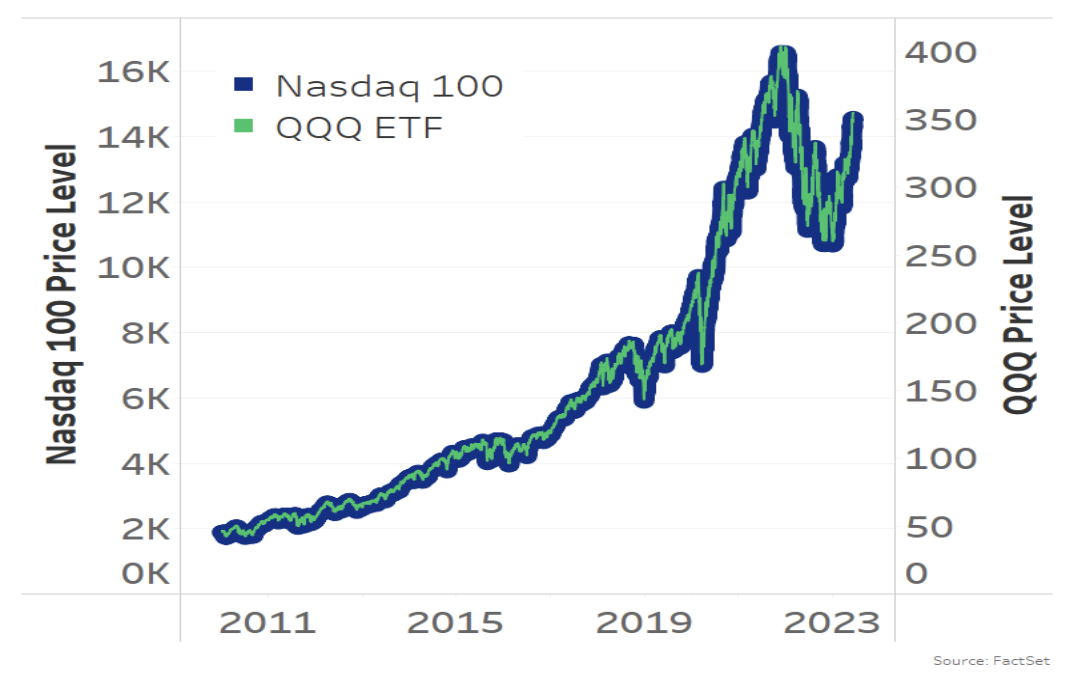
We can see that’s true by looking at how the QQQ ETF tracks its Nasdaq-100 benchmark below. For most large index funds, tracking error (or the difference between daily fund returns and index returns) is almost zero.
Chart 2: Performance of the QQQ index fund completely matches the Nasdaq-100 index
How do index funds minimize tracking error?
The most popular indexes are designed to represent broad market portfolios. That’s why the media likes to talk about returns of the S&P 500, the Dow Jones and the Nasdaq Composite indexes to describe whether the market has been up or down. However, indexes can reflect all sorts of subsets of the market, from small cap to value to stocks in the same sector.
In any market, as small companies grow or large companies shrink, the index they belong to can change. As a result, even index funds need to change their portfolio holdings every so often.
Usually, these updates to indexes (additions, deletions, shares outstanding and float adjustments) are made on a single date each quarter or year. That helps index funds manage turnover, too, as they can use cash raised from sales (deletes) to buy new additions to the index.
Importantly, when indexes (like Russell) make changes, they don’t actually trade.
However, the index funds tracking the index do hold stocks, so they do need to trade. And to minimize tracking error they need to trade at exactly the same time as the index changes occur.
We can see how that works in practice in the diagram below.
When an index removes (or deletes) a stock, it does so at the “last price” of the day and adds the new stock at the same time. To replicate this “virtual trade” of the index, an index portfolio manager needs to execute the same real trade by:
- Selling the deleted stock at the market close.
- Buying the addition at the market close.
- And often reinvesting (or divesting) cash across the portfolio if the size of the add and delete is not equal, so the portfolio remains fully invested.
Chart 3: Example of how indexes rebalance
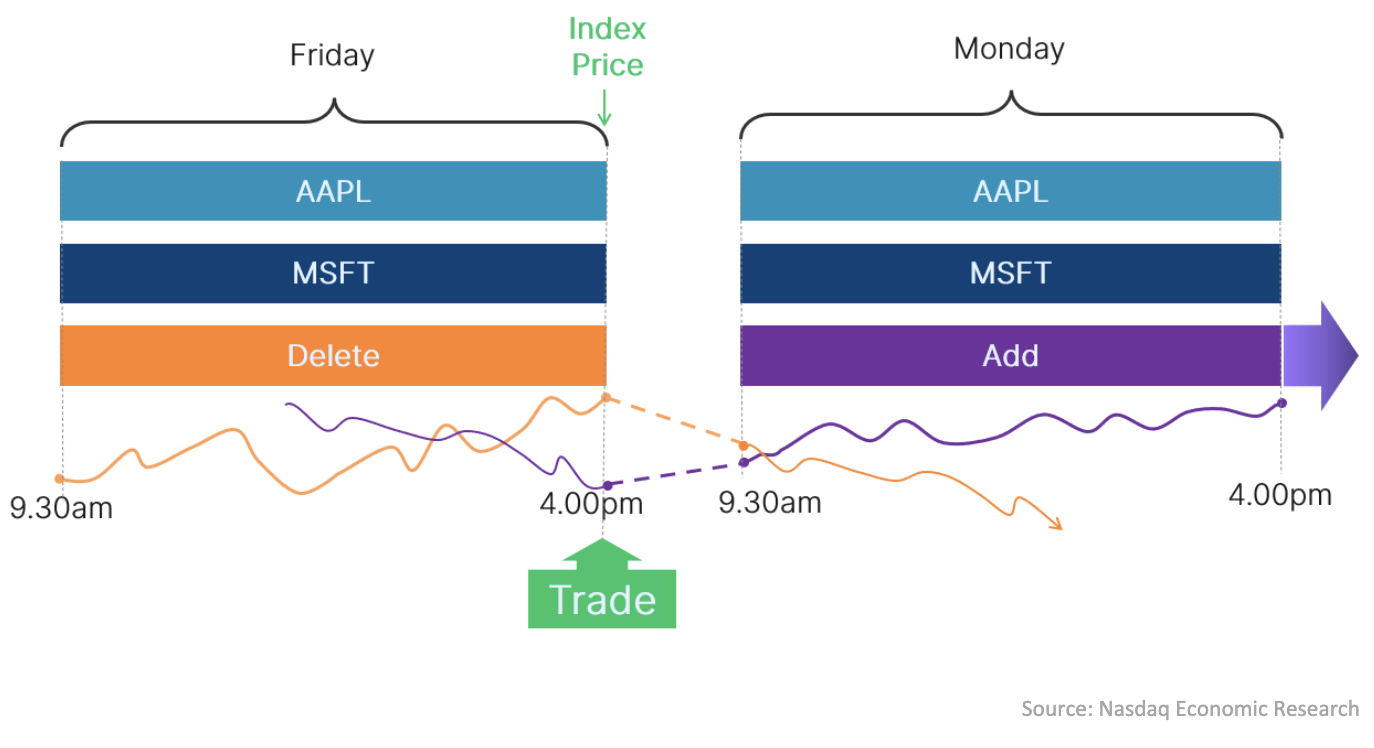
If an index fund failed to do this, they would still own the delete on Monday.
In this example, assuming for simplicity that all other stock prices are unchanged:
- As the price of the deleted above fell (orange line), the fund’s return would be negative.
- As the index now has the added stock, which rallied on Monday (purple line), the index would have a positive return.
- And that difference in returns (in this case, underperformance) is tracking error.
Even if the opposite happened (and the index portfolio beat the market), that still results in tracking error, which is bad because it shows the portfolio manager taking on risk and not following their mandate.
Because of that, the majority of index trading occurs in the market’s closing auctions.
How much do index funds trade on the close?
For the most popular (market cap) indexes, each index fund will own a slice of each company — all of which are weighted based on capitalization. As a whole, they will own (say):
- Eight shares in a company with 100 shares outstanding, and
- Eight million shares in a company with 100 million shares outstanding
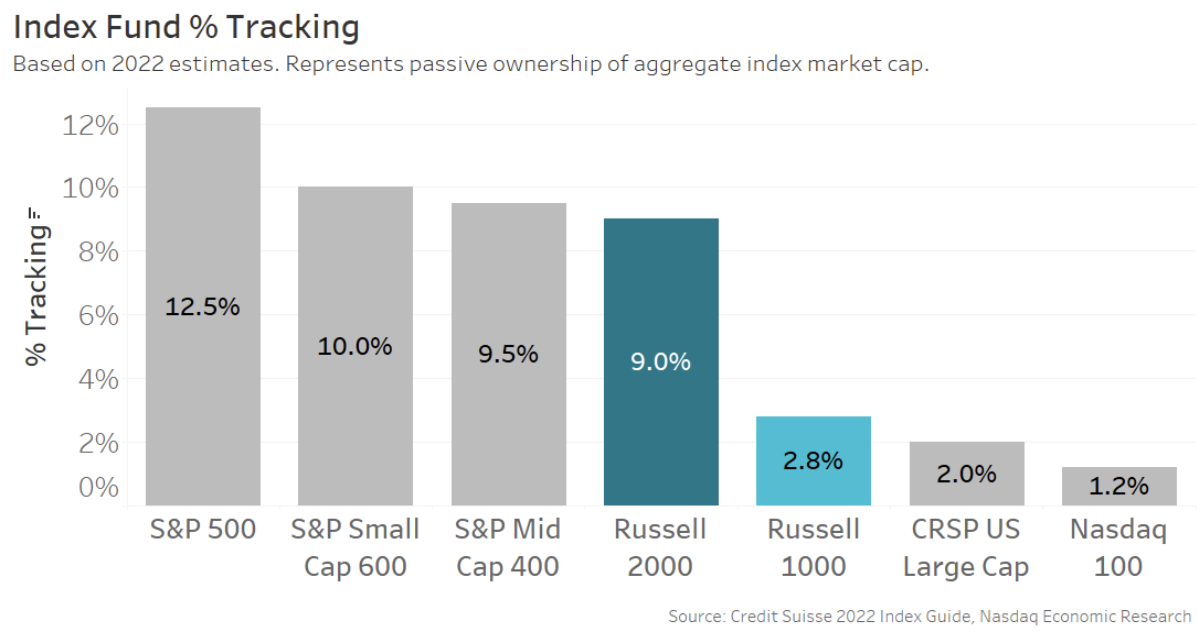
However, according to index providers and broker analysis, each index has a different market share (Chart 4).
It is possible for a company to be included in more than one index. For example, a large-cap company could be included in the S&P 500, the Russell 1000, the CRSP and Nasdaq-100 index. If that occurred, indexers would own 18.5% of the shares outstanding.
However, for small-cap stocks, the Russell 2000 and the S&P 600 are the most important indexes for inclusion. Although, a small company needs to have a market cap of at least $600 million to qualify for the S&P600 index. The broader Russell 2000 is more likely to be the first small-cap index many companies are included in, including companies with a market cap as low as around $160 million this year.
And starting next week, a company added to the Russell 2000 should expect to have new Russell index fund owners adding to around 9% of its free-float shares.
Chart 4: Index tracking as a percentage of shares outstanding for the most popular U.S. indexes
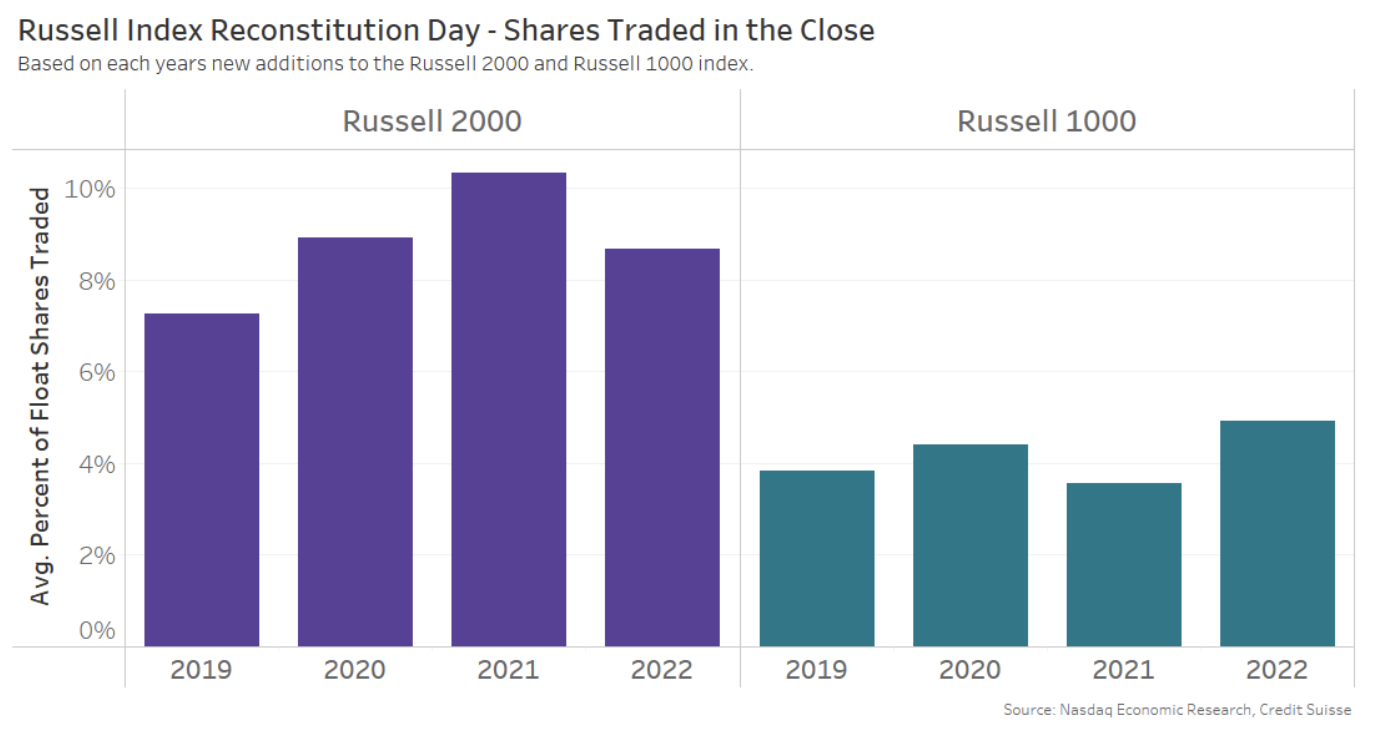
Another way to reconcile these market share data is to look at how much of each of the added company's shares outstanding are traded at the close (and at the closing price) on the Russell reconstitution date.
As the data shows, the closing trades add around 8%-10% for Russell 2000 index additions and around 4% for Russell 1000 index additions.
Chart 5: Close trade for index additions as a percentage of each company’s shares outstanding
How do index funds trade that much on the close?
The data above shows that a single closing auction can easily make up almost 10% of a company’s shares outstanding. That seems, at first, hard to believe, especially for a small-cap company.
However, index funds are usually pretty rules based. In addition, demand like this is expected to cause prices to rise, creating a trading opportunity for anyone willing to warehouse liquidity ahead of the index trade for a profit.
As a result, there are hedge funds and brokers forecasting Russell adds and deletes months in advance.
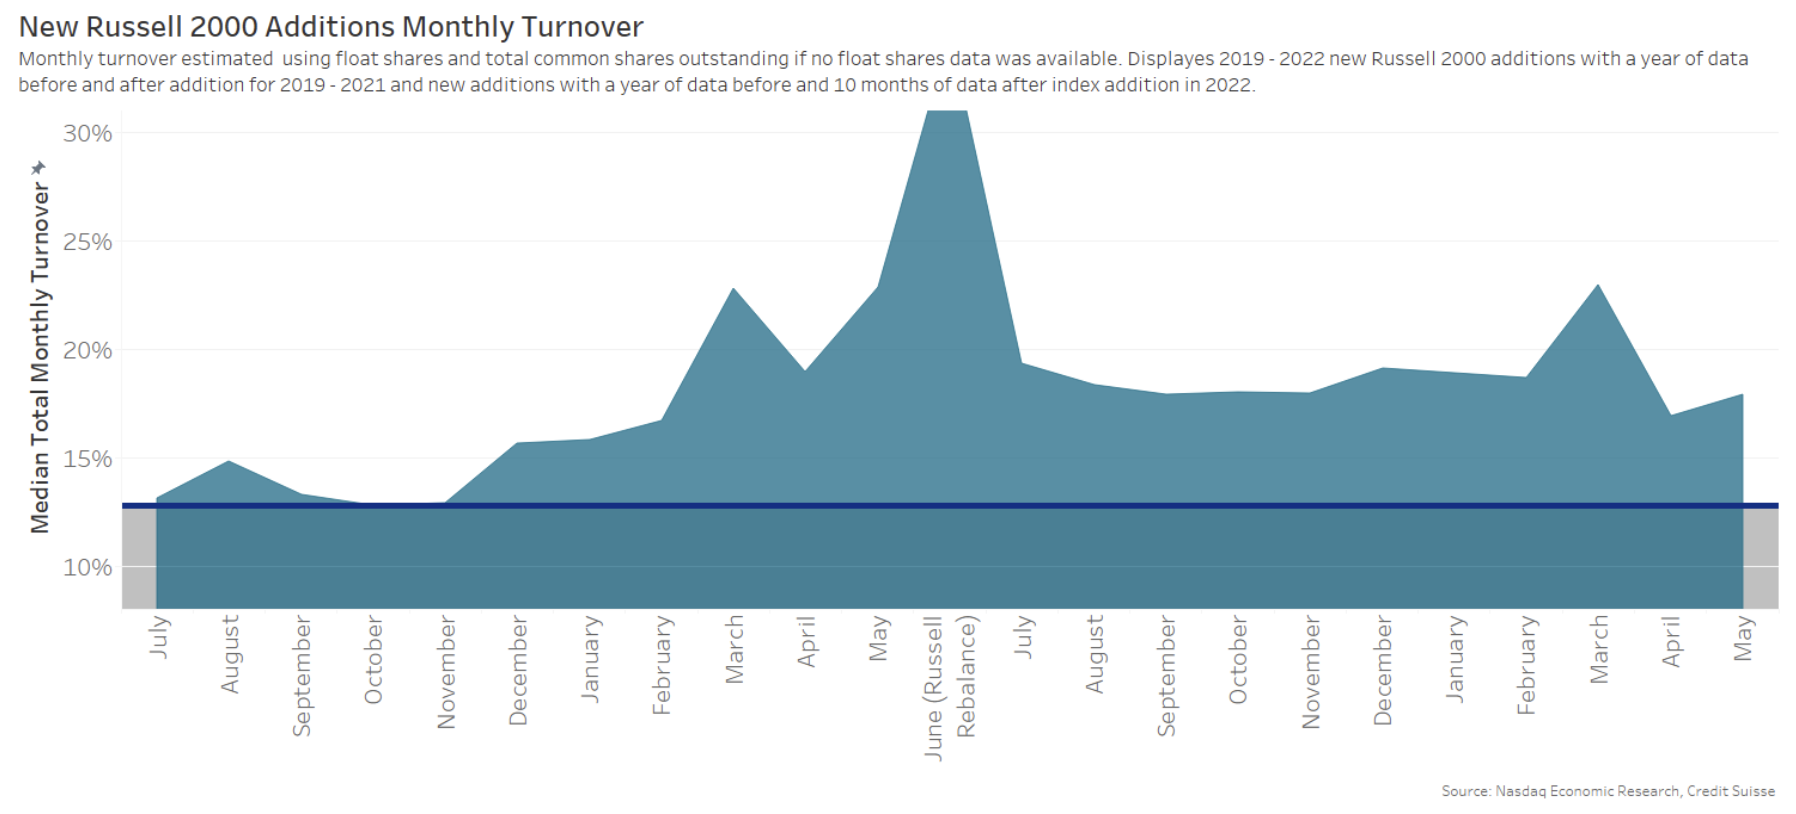
We can see this liquidity provision in Chart 6 below. This shows that liquidity in the Russell 2000 additions (measured as monthly turnover, annualized) increases starting in December (6 months before the addition).
But this is not “risk-free money” for traders. For a start, executing a very large active trade would cause market impact too. And with many of these stocks difficult to hedge, liquidity providers are taking on significant stock-specific risks (especially over six months). In addition, other research shows that returns on the day of the rebalance trade are small (and shrinking), indicating that the market is efficiently providing this liquidity to index funds on the rebalance date.
Chart 6: Increase in liquidity for Russell 2000 additions starts months before index addition and remains elevated afterward
Addition is good for your stock
There are other reasons index inclusion is good for your stock. FTSE Russell estimates a total of $12.1 trillion is benchmarked in funds to its U.S. indexes once you include active funds.
Although active funds aren’t constrained by tracking error, they will be underweight all of the additions as soon as the reconstitution trade has happened. Consequently, even active funds start to pay attention to and trade new index additions. This helps explain the persistence of elevated volumes even after the index rebalance trade is finished in June. It also means even more mutual funds are likely to end up owning these stocks.
How does the closing auction work?
Closing auctions are important every day, as they are the prices used to invest mutual fund cashflows, calculate fund returns, and determine portfolio risk.
Different exchanges have their own listing and trading rules. Consequently, the close works a little differently depending on where a stock is listed. We show the key rules for NYSE and Nasdaq listings below.
Table 1: Closing auction rules for Nasdaq and NYSE listings
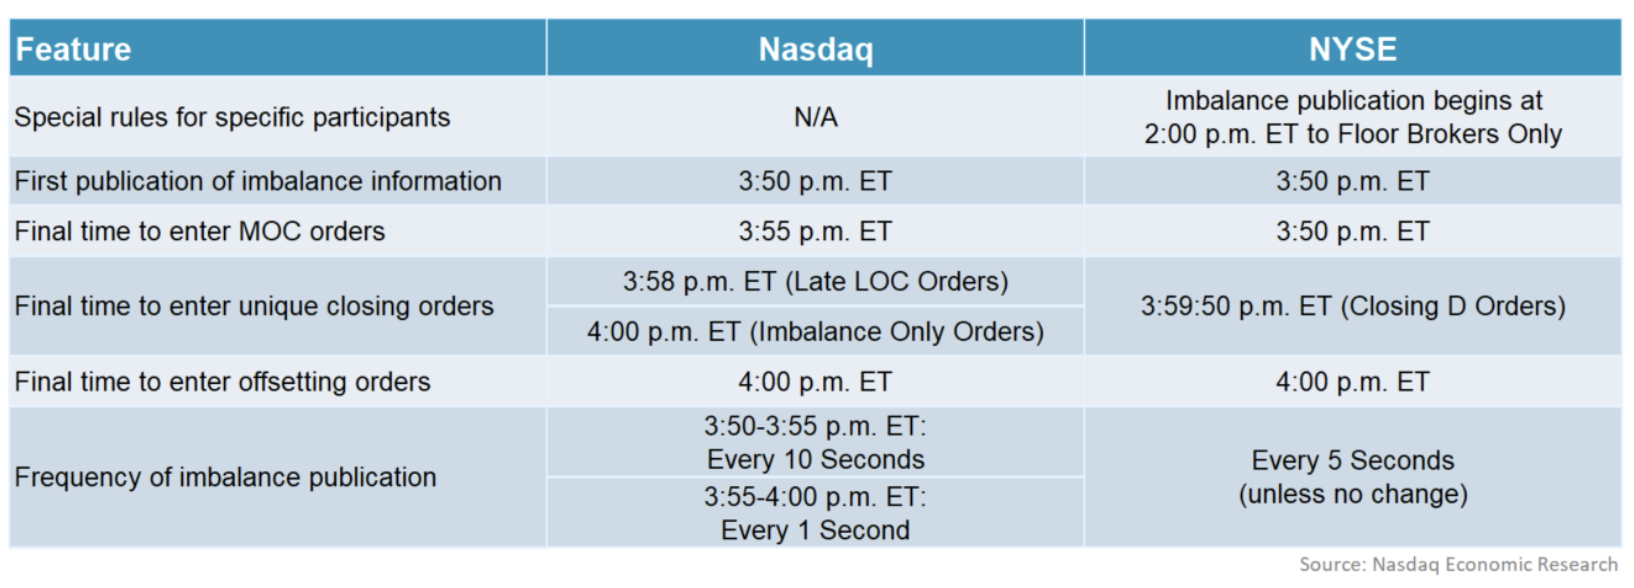
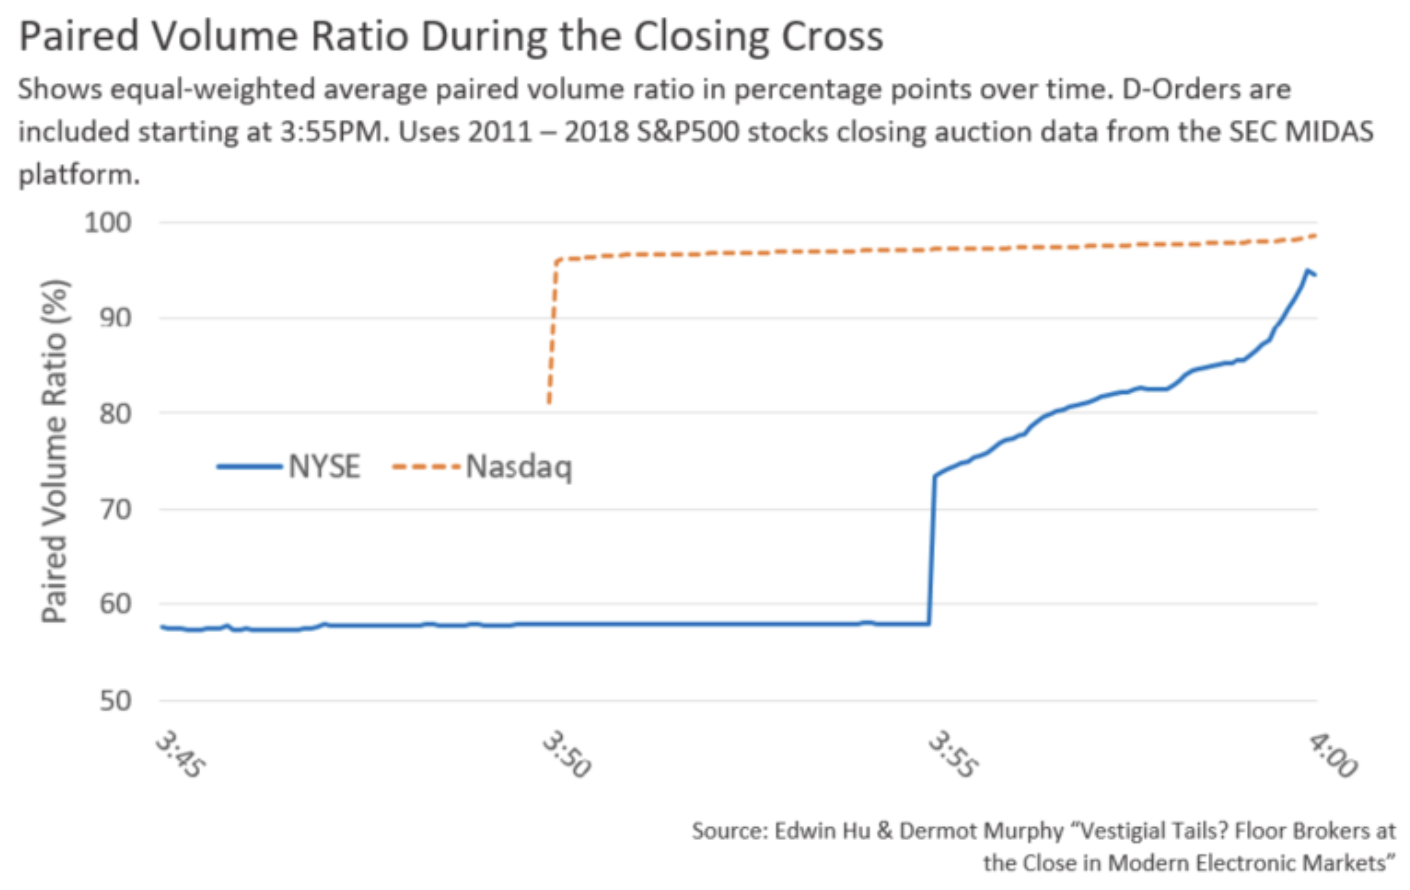
One of the main differences between both closes is the amount of discretion allowed for select participants in the NYSE close via different order types and the ability to cancel firm orders late in the day.
How does our closing auction compare?
We know minimizing closing volatility is important for issuers. Consequently, we’ve done extensive research on how to design a less volatile closing auction.
Our order types include orders that automatically offset liquidity imbalances, indicative close prices that allow new orders to be added at limit prices that reduce volatility with high certainty of execution, and an inability to cancel a firm order once the market believes equilibrium has been established.
Academic research confirms that our approach leads to lower volatility and a more predictable close for investors.
Chart 7a: Difference between pre-auction indicated prices and actual close price
Chart 7b: Difference between pre-auction indicated volumes and actual close volumes
The Russell recon is important for issuers and investors
Each year, the Russell reconstitution is the largest close trade of the year, with trades worth over $100 billion being executed, ensuring the smooth transition to new portfolios for trillions of dollars of investors’ assets, all with minimal tracking error.
This year is the 20th consecutive year Russell will use the Nasdaq’s auction price for its annual reconstitution. Last year on the Russell reconstitution date, we traded 3.3 billion shares across 3,873 symbols with a value of $63.8 billion in just 2 seconds. In contrast, NYSE closed 38% fewer tickers but took over 13 minutes longer to set its MOC prices.
Chart 8: Number of stocks in the close and time to complete all auctions by listing exchange
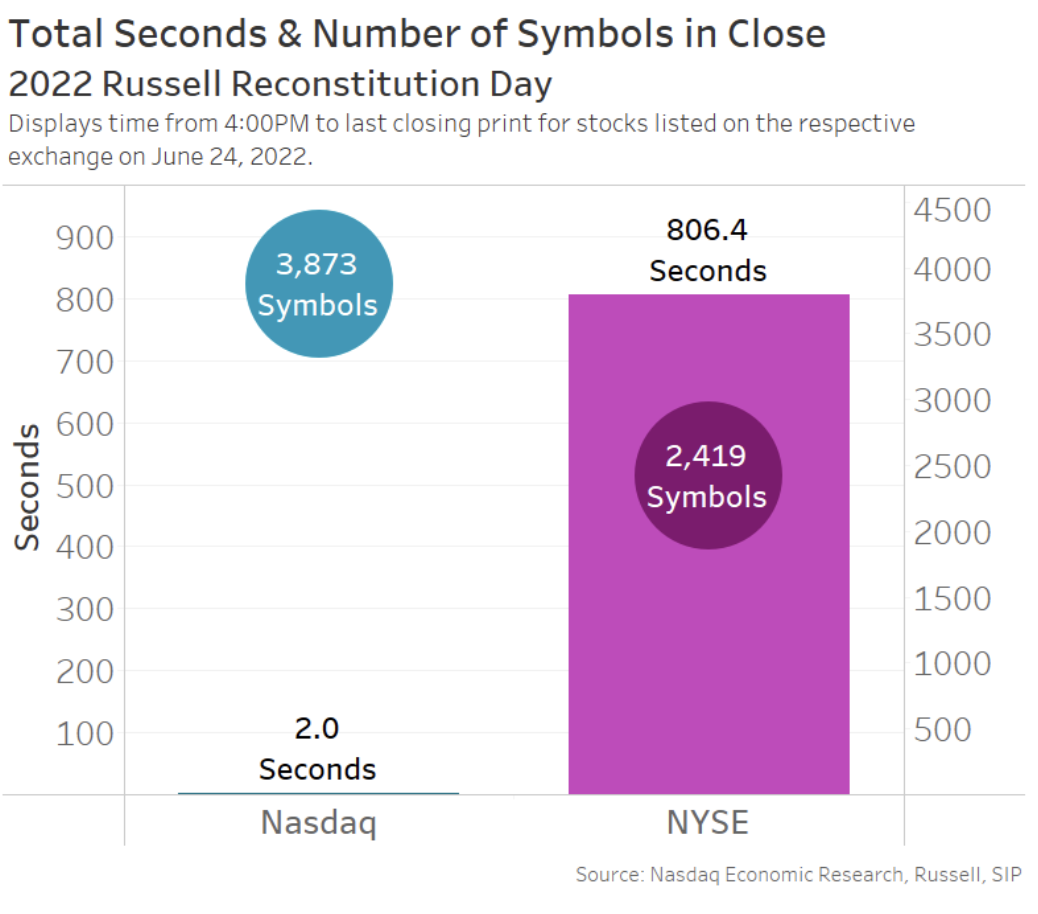
Since Nasdaq lists so many companies in the Russell indices, the Nasdaq closing cross is important to thousands of issuers and investors as a source of liquidity that can help reduce index fund trading costs and for traders to manage their risks.
And tomorrow is the day when hundreds of Nasdaq companies enter the Russell indexes for the first time, broadening their universe of potential investors.
Other Topics
US Markets Markets Indexes
Phil Mackintosh
Nasdaq
Phil Mackintosh is Chief Economist and a Senior Vice President at Nasdaq. His team is responsible for a variety of projects and initiatives in the U.S. and Europe to improve market structure, encourage capital formation and enhance trading efficiency.
Read Phil's Bio