
What Should We Do When an ETF Doesn't Close?
We all know the closing cross is usually the largest liquidity event, and the most important price event, each day in the U.S. equity markets. The closing cross sets benchmarks, funds cash flows and facilitates index rebalances in a way that ensures indexes have no tracking error.
In talking to our listing companies, it is also one of the few pieces of market structure that most of them care a lot about.
But did you know that not all stocks have a closing auction each day? That’s a particular problem for some ETFs.
The majority of ETFs don’t have a closing cross
It’s true. Lots of ETFs don’t actually have a trade in the closing auction, especially thinly-traded ETFs. In fact, more than 1,600 symbols have a close less than 50% of the time.
That’s not a problem for most investors. As the data in Chart 1 below shows, ETPs that trade more than 500,000 shares per day almost always have a trade in the close. You can also see from the yellow color of the bars, that these ETFs trade with very tight spreads: three basis points (bps) or better on average. That’s cheaper than trading most stocks. But most importantly, the thickness of the bars shows that the majority of ETF trading also occurs in these stocks (94%).
The problem is the more thinly-traded ETFs. For example, the ETPs trading on average 100,000 to 500,000 trade about three-fourths of the time in the cross, whereas those trading less than 50,000 per day have a close on just 12% of days, that’s around once every two weeks.
That means that the “last price” can be really stale. That can result in old valuations in brokerage and margin accounts. It can also distort risk in a market makers otherwise well-hedged positions. In fact, we found instances where ETFs had not traded for 10 or more trading days, resulting in very stale “last trade” marks.
Chart 1: Proportion of ETFs that close every day

Source: Nasdaq Economic Research
The majority of ETFs trade with tight spreads intraday
Although there are a lot of thinly traded ETFs, most of them trade with tight spreads intraday. That seems to indicate that even without a close price, the bids and offers are pretty efficiently pricing the fair value of the ETFs. If they didn’t, arbitrageurs would quickly trade a “stale” ETF bid vs. a more accurate and liquid ETF offer, or even the underlying basket.
That’s important, as it means the market is valuing the ETFs efficiently intraday, even though there is no actual trading happening.
It’s also possible that quotes might be a better “last price” than last price.
Let’s take a look.
Liquid ETFs show quotes are quite good at estimating the MOC price
First, let’s look at how well intraday prices value ETFs that do have a closing auction trade. The results are comforting and useful; our data shows a few things.
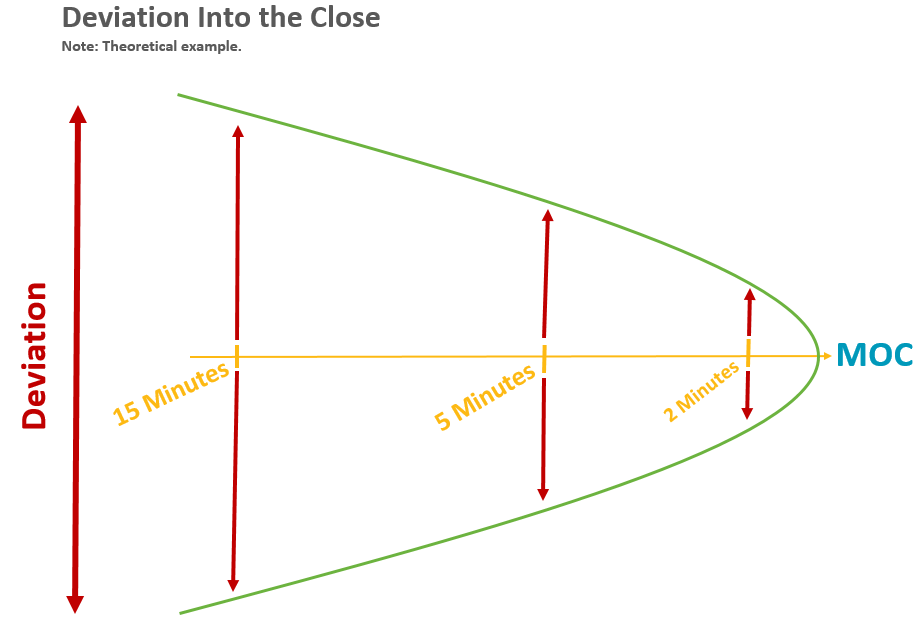
Not surprisingly the last two minutes of the day is a better estimate of the close than longer periods. That shouldn’t surprise anyone. It’s well known that the variance of prices evolve in a parabolic (technically a root) function the further you move forward or backward in time.
Chart 2: With constant volatility, prices naturally diverge further from any snapshot as time increases
Source: Nasdaq Economic Research
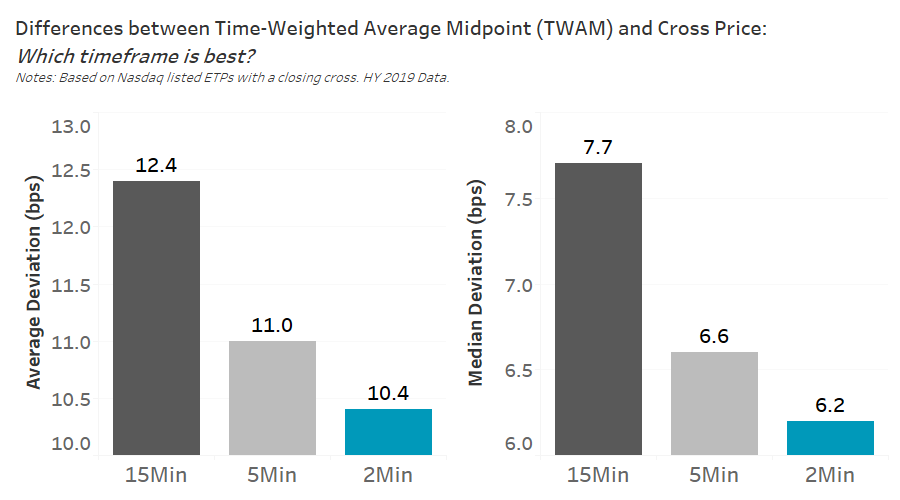
For a two-minute interval Time-Weighted Average Midpoint (TWAM,) the average deviation of the TWAM to the actual close was just 10.4bps, which was 5% lower than the deviation in the five-minute interval, and 16% lower than the deviation in the fifteen-minute interval, respectively. Even among liquid ETFs, we also see a much tighter median deviation of 6.2bps from the actual MOC price, highlighting that the more liquid an ETF, the more efficient its price is.
Chart 3: Quantifying different close estimations shows two-minute TWAM is the best predictor of close
Source: Nasdaq Economic Research
Given these results, quotes look like a good proxy for a fair valuation.
In short, there is evidence here to support the fact that because ETFs are a derivative of an underlying basket, efficient market maker bids and offers will accurately price the ETFs themselves.
But how good are thinly-traded ETFs quotes?
Before we can be completely comfortable saying market maker quotes are a better approximate the ETF close price, we need to check that market makers also quote thinly traded ETFs well.
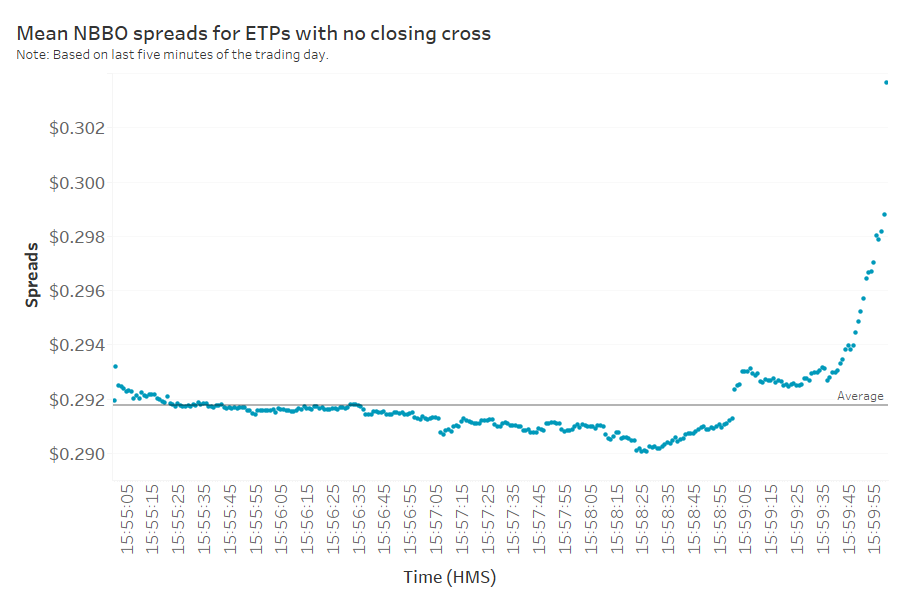
First we looked to see how tight spreads stay over the last five minutes of the day. Data in Chart 4 shows that spreads are very consistent from 3.55.00 through to 3.59.00. Although the uptick we see at 3.59.00 is clear in the chart, and seems to indicate a systematic risk reduction at that time, it’s not a material change given the scale of the chart.
We see a more significant widening at 3.59.55. Although even that only adds fractions (not multiples) of the spread. Despite that, we think this highlights market makers’ concerns about entering the close with a new position that would be more difficult to hedge. Consequently, we think it would be prudent to ignore these last few seconds.
Chart 4: Thinly-traded spreads do drift wider into the close
Source: Nasdaq Economic Research
What’s the worst thing that can go wrong?
For extremely thinly-traded ETFs, there may not be effective market making. If that is the case, the spread may be not only extremely wide, but biased to buy or sell, making the mid less useful.
However, looking at the data, we see that even in cases where the spread widens by over $1.00 in the last 10 minutes, which happens less than 0.05% of the time, the change in mid is less than 50bps. Similarly, when spreads widen by 100bps in the last 10 minutes, the mid changes by just 30bps on average. So there is little evidence that the midpoint is changing materially. Instead, the results indicate both bids and offers are widening.
Table 1: Looking at midpoint changes on extreme spread-widening events

A better thinly-traded ETF MOC price
The market has been asking for a better ETF close price for ETFs that don’t have trade in the auction. Based on this research, it turns out a pretty simple solution actually gives the best price.
That solution is a time-weighted average price, over the last two minutes of trading, excluding the prices in the last five seconds of the day.
So that’s what Nasdaq has proposed with our new rules for Official Closing Price (“NOCP”) on Nasdaq-listed ETPs. Earlier this month the SEC extended its review period to November 21 from October 7.
Bonus section: how exactly would the Time-Weighted Average Midpoint work?
So, how would the TWAM work?
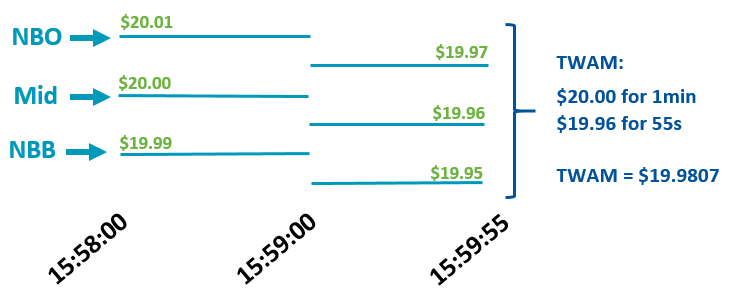
The TWAM price would be a weighted average midpoint value calculation that uses eligible NBBO quotes during the defined time period 15:58:00 – 15:59:55.
Let’s look at the example in Chart 5 below. Say the NBBO is 19.99 x 20.01 (midpoint = $20.00) starting at 15:58:00 through 15:59:00. Then, from 15:59:00 through 15:59:55 the NBBO is updated to 19.95 x 19.97 (midpoint= $19.96). The TWAM in this instance will be $19.98 (19.9807).
Chart 5: Illustration of the TWAM leading into the close
Source: Nasdaq Economic Research
For additional information regarding the enhanced closing price for ETPs, click here.
Other Topics
Markets
Phil Mackintosh
Nasdaq
Phil Mackintosh is Chief Economist and a Senior Vice President at Nasdaq. His team is responsible for a variety of projects and initiatives in the U.S. and Europe to improve market structure, encourage capital formation and enhance trading efficiency.
Read Phil's Bio