
Last week, we looked at the performance of different asset classes in 2023.
This week, we want to see what that means for where valuations are starting the year, and what that might mean for stock performance (of course this isn’t investment advice).
Most Large-Cap sectors valuations around fair value, except IT (Rich) and Energy (Cheap)
For large caps, most sectors are relatively close to their average PE valuation over the last 10 years (chart below, dots near 45-degree line).
So these sectors are relatively “fairly valued,” with investors willing to pay roughly the same amount for future earnings as they have over the last 10 years.

There are two clear exceptions, both of which make sense:
- Information Technology (red circle) is rich (red area). That’s because, as the epicenter of AI (it’s chip makers and software and hardware companies), investors optimistic about AI have gotten ahead of earnings beyond just the next 12 months.
- Energy (green circle) is cheap (green area). That’s because it’s been hurt by falling oil and gas prices as supply improved after the initial shock from the war in Ukraine and demand slowed. As a result, 2023 earnings growth was negative 30% p.a. Even in 2024, Energy earnings are expected to fall another 2.3% p.a.
Small- & Mid-Caps Valuations Cheap, Growth Rich
Valuations for small-caps (S&P 600) and mid-caps (S&P 400) are still cheap vs their 10-year average (chart below, green circle).
So for these stocks, investors have been willing to pay less for the same amount of earnings than they have historically, which means they might be undervalued.

Growth stocks (companies expected to grow faster than average), though, are currently “rich” (red circle) – or potentially overvalued.
Analysts still see upside for Magnificent 7, helped by expected margin expansion
Some of that has to do with the Magnificent 7 (Alphabet, Amazon, Apple, Meta, Microsoft, Nvidia and Tesla). These are all considered Growth stocks, and they gained 77% as a group last year.
However, much of the Magnificent 7’s rally was supported by earnings growth, with their forward earnings increasing 51% in 2023 largely due to AI optimism (left chart, blue line).
The problem is not all Growth stocks saw such strong earnings growth.
And valuations for the Magnificent 7 are a bit rich. Their forward PEs increased from 23 to 29 in 2023 (right chart, blue line), above their 10-year average PE of 25.7. But this makes sense for the same reasons that Information Technology looks rich.

Still, analysts see upside for the Magnificent 7 stocks. They’re looking for an average gain of +11% this year.
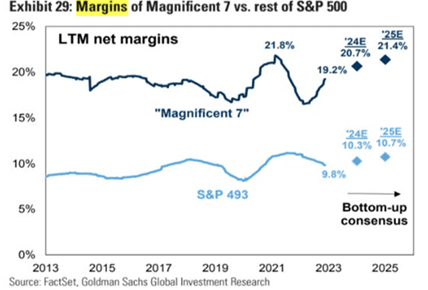
That view is supported by expected margin expansion over 2024 and 2025 for the Magnificent 7 (Goldman Sachs chart below, dark blue diamonds) – and faster margin growth than the rest of the S&P 500 (light blue dots).
Cheap valuations and healthy economic growth outlook support small-cap upside
Even if the Magnificent 7 manage another 11% gain this year, Goldman Sachs sees small caps (Russell 2000) outperforming – gaining 15%. That’s also better than their projected 7% gain for the large-cap S&P 500.

That’s because, in recent decades, two-thirds of Russell 2000 one-year returns have been driven by starting valuations and economic growth.
So with the Russell 2000 still cheap at a price/book ratio of 2.0x – below its long-term average of 2.1x – and Goldman forecasting 2% US GDP this year, that’s historically been a recipe for a rally. (Recent technical analysis from Nasdaq’s Market Intelligence Desk team also supports a Russell 2000 rally.)
Upturn in interest rates would threaten small cap prospects, given larger share of floating rate debt
Of course, this isn’t without risks. A renewed upturn in interest rates could threaten Russell 2000 prospects.
That’s because these small caps have a 5x larger share of floating rate debt (chart below).
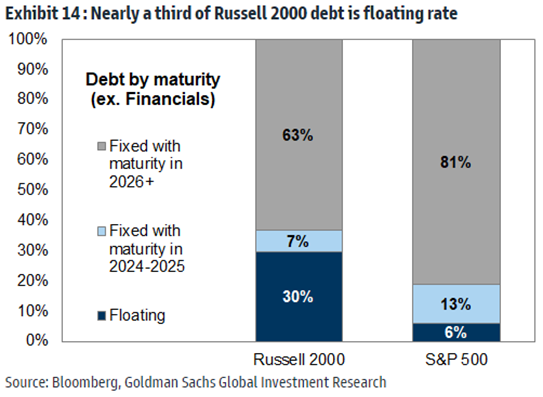
On top of that, the Russell 2000 has heavy weights for interest-rate sensitive sectors, like Biotech, Banks and Real Estate.
But, if interest rates hold steady or drop, that should be a positive for small caps and interest-rate sensitive sectors more generally.
The information contained above is provided for informational and educational purposes only, and nothing contained herein should be construed as investment advice, either on behalf of a particular security or an overall investment strategy. Neither Nasdaq, Inc. nor any of its affiliates makes any recommendation to buy or sell any security or any representation about the financial condition of any company. Statements regarding Nasdaq-listed companies or Nasdaq proprietary indexes are not guarantees of future performance. Actual results may differ materially from those expressed or implied. Past performance is not indicative of future results. Investors should undertake their own due diligence and carefully evaluate companies before investing. ADVICE FROM A SECURITIES PROFESSIONAL IS STRONGLY ADVISED. © 2024. Nasdaq, Inc. All Rights Reserved.
