
Third Quarter 2019 Review and Outlook
Executive Summary:
- The Fed embarked on this decade’s first rate cut cycle with two 25bps rate cuts.
- In late August the curve completely inverted with all maturities yielding less than the FFR.
- The Fed implemented “temporary” repo operations to relieve short term funding stresses.
- Large caps outperformed small and defensives outperformed cyclicals.
- Value outperformed growth by 360 bps in September but still unclear if this is a lasting trend.
- The greenback continued to strengthen against most currency pairs.
A dizzying Q3 is officially in the books and for many it could not have ended soon enough. The major large cap equity indices registered new all-time highs in July, but then followed it up with a wave of risk-off price action in August and a sector rotation into previously underperforming value industries over the ensuing rebound in September. The Federal Reserve embarked on a new easing cycle with two rate cuts, but the initial reductions at the July FOMC was received as being more hawkish than many were expecting. This was followed by historic declines on the long end of the curve and a temporary inversion of the 10YR – 2YR spread for the first time in more than ten years. To the dismay of President Trump, the greenback saw broad strength vs. most other currencies. Brent and WTI crude declined 8.5% and 5.8% despite a wave of drone and missile attacks against Saudi Arabia’s energy infrastructure. Large caps continued to outperform small however defensives trounced cyclicals. Growth edged out value for the quarter despite value outperforming growth by 340bps in September, one of its best relative performances in more than ten years.
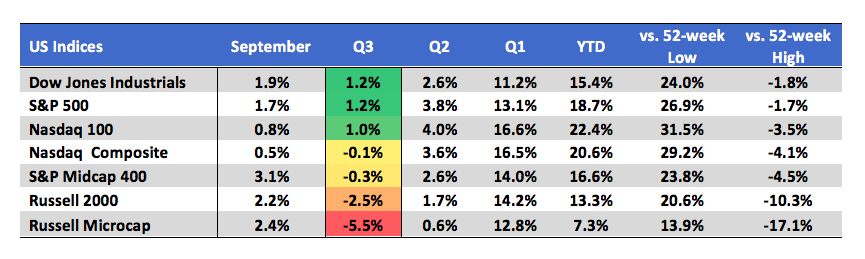
The large cap Dow Jones Industrials (+1.2%), S&P 500 (+1.2%), and Nasdaq 100 (+1%) indices finished marginally higher in Q3. Mid- and small-cap stocks finished in the red as seen by the Russell Microcap (-5.5%), Russell 2000 (-2.5%) and S&P Midcap 400 (-0.3%) indices.
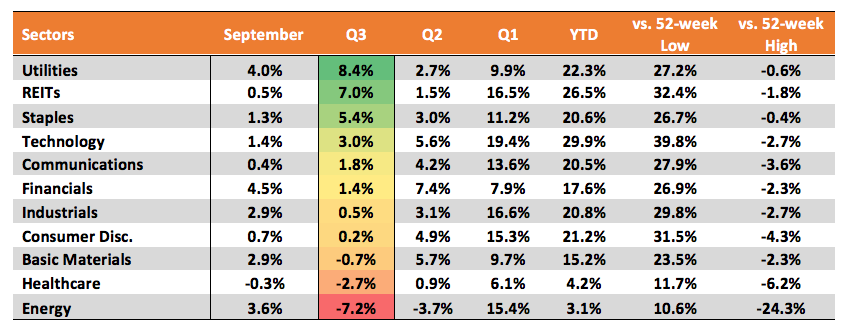
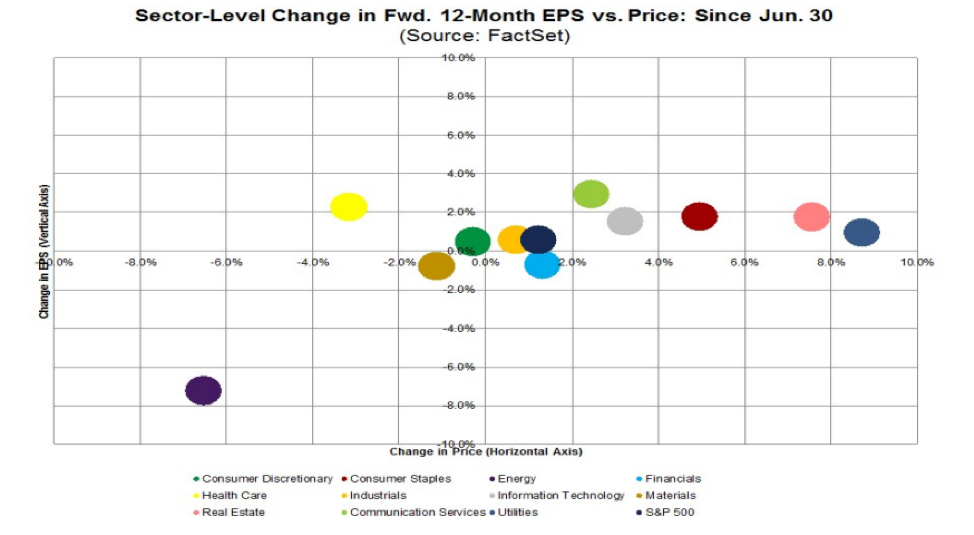
Underneath the hood of the market, the defensive Utilities (+8.4%), REITs (+7%), and Consumer Staples (+5.4%) outperformed in Q3 aided by the demand for safe havens and steep decline in rates. On the other end of the performance spectrum were Energy (-7.2%), Healthcare (-2.7%), and Materials (-0.7%). For all of 2019 Technology (+30% YTD) remains the top performer, followed by REITs (+27%) and Utilities (+22%).
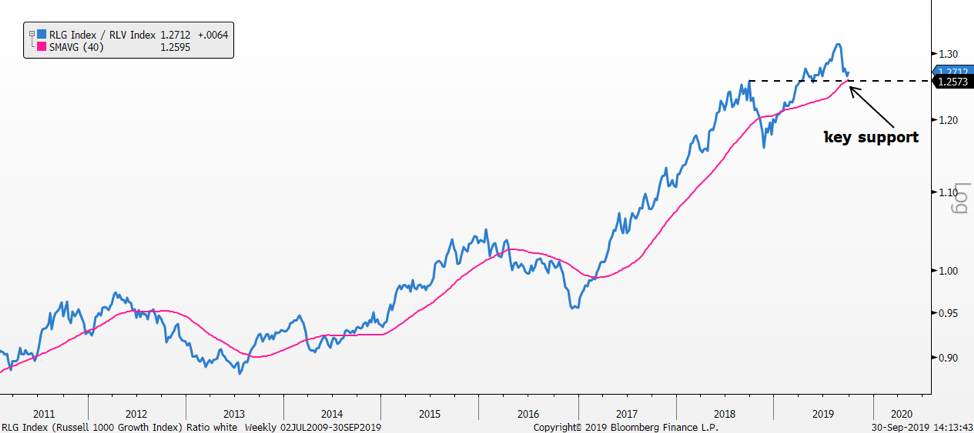
Much has been made about the September rotation from growth into value. Many market participants expect this recent trend of value outperformance to be here to stay, however from a technical perspective it is too soon to make that call. The ratio of the Russell 1000 Growth index over the Russell 1000 Value Index (RLG / RLV) shows the long term uptrend remains intact. Despite the recent pullback, the ratio remains above the prior high from September 2018, which coincides now with the 40-week moving average. Until this cluster of support gives way, the long term trend of outperformance continues to favor growth.
More fundamentally, the shift into Value from Growth last month reflects the broader sector moves. “Value” sectors like Financials (higher rates) and Energy (Saudi attacks) outperformed as Growth sectors like discretionary and Technology (political/regulatory issues) came under pressure.
The bond market was the big story in Q3. The Fed embarked on its first rate cut cycle in over ten years by reducing the overnight fed funds rate 25bps at both the July and September FOMC meetings. The initial cut in July was proceeded by historic declines in the 10YR and 30YR yields, a temporary inversion of the 10YR – 2YR spread, and a new all-time low for the 30YR yield. In late August the entire curve was trading below the overnight funds rate. In early September many short term funding rates ballooned higher including the overnight fed funds rate reaching 3%, despite the Fed’s then 2% - 2.25% target range. The Fed has since been forced to implement daily repo operations for the first time since emerging from the financial crisis. A more permanent fix to the liquidity crunch could be announced at the October meeting. Some “plumbers” are expecting a permanent repo facility while others see the need for a more impactful QE-like response.
On September 16th Brent crude spiked a record 20% in one session following coordinated drone and missile strikes against Saudi Arabia’s energy infrastructure in what was one of the worst ever disruptions of crude output. While full capacity has yet to be restored, the recovery has gone faster than expected and Brent prices retraced 100% of their gains within two weeks. For the quarter Brent and WTI declined 8.5% and 6.5%. Signs of weakening global growth also played a part.
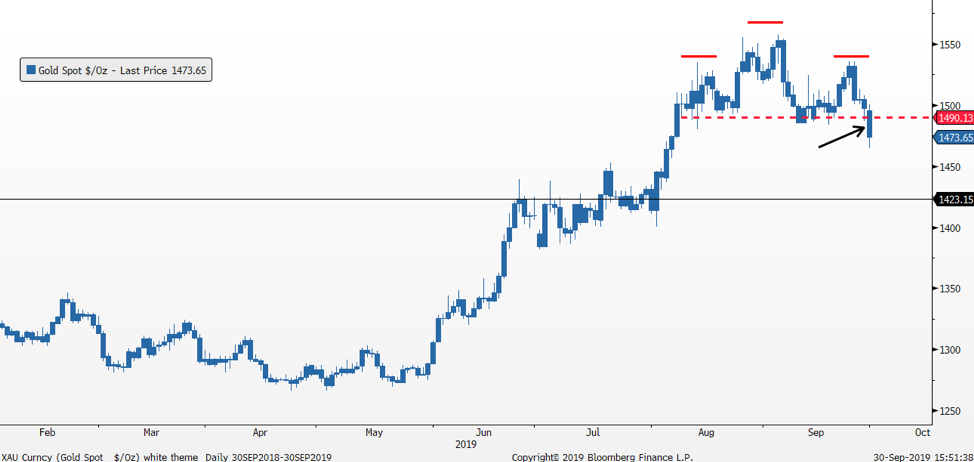
Precious metals gold and silver gained +4.5% and +4.9% respectively in Q3, but each closed out the quarter on a sour note with declines of 3.2% and 8.7% in September. On the last trading session, gold broke below a key near term support level, $1,490, which represents the neckline of a common topping pattern (head & shoulders). The size of the pattern projects a minimum measured move to the $1,420 level, a logical support line where gold previously consolidated throughout all of July.
Q3 Earnings:
According to FactSet, Q3 earnings for S&P 500 companies are currently expected to decline by 3.7%, the third straight quarter of year over year declines and the first time since Q4 2015 - Q2 2016 that earnings have declined three quarters in a row. For the quarter, five sectors are predicted to report y/y earnings growth, led by the Utilities and Real Estate sectors. Six sectors are projected to report y/y declines, led by Energy, Information Technology, and Materials.
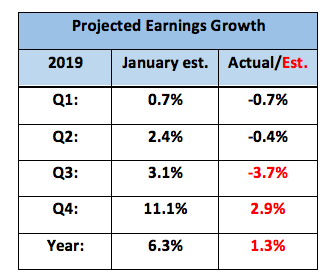
Looking ahead, analysts are projecting earnings growth of 2.9% and revenue growth of 3.6% for Q4. Earning growth in January for Q4 was expected to be 11.1% so the trend of lowered expectations continues. Still, if estimates fall into place as expected, the full-year earnings growth for S&P 500 companies would be 1.3% with revenue growth of 4.1%.
The trend in 2019 for each quarterly earnings season has been for negative comps vs. the year ago period. Analyst estimates shrink as the quarter approaches and then companies beat these lowered estimates by a little bit so that earnings beat rates remain near the 76% long term average. Back in June, Q3 earnings growth was projected at -0.6% vs, a positive estimate of +3.1% in January (table below). Earnings growth in Q2 ended up at -0.4% while earnings growth in Q1 was -0.7%, so the negative quarters are only slightly so. The table below captures the decline in earnings expectations as 2019 has unfolded. Given the trend, Q4 estimates, which have already fallen sharply this year could be at further risk.
Looking Ahead:
There is plenty to look forward to in October. Next week the large money center banks un-officially kick off Q3 earnings season. Senior officials from the U.S. and China are expected to reengage trade talks as the Trump administration is reportedly mulling ideas to impose limits on U.S. investments in Chinese companies and financial markets. The current Brexit deadline is scheduled for October 31st and it is a coin toss as to whether there will be a revised deal, another “kick the can” postponement, or a no-deal exit. At the October FOMC the Fed could announce a permanent fix to the plumbing problems arising in the short term funding markets. Plumbers seem to be more concerned the spike in repo and overnight rates is a canary in the coal mine reflecting deeper and more serious concerns within the capital markets which need a QE-like, bazooka response. Others see it as an easily-fixed operational discrepancy resulting from a perfect storm of events that are already subsiding.
Nasdaq's Market Intelligence Desk (MID) Team includes:
Charles Brown is Associate Vice President on The Market Intelligence Desk with over 20 years of equity capital markets experience. Charlie has extensive knowledge of equity trading on both floor and screen-based marketplaces. Charlie assists with the management of The Market Intelligence Desk and works with Nasdaq listed companies providing them with insightful objective trading analysis.
Steven Brown is a Managing Director on the Market Intelligence Desk (MID) at Nasdaq with over twenty years of experience in equities. With a focus on client retention he currently covers the Financial, Energy and Media sectors.
Christopher Dearborn is a Managing Director on the Market Intelligence Desk (MID) at Nasdaq. Chris has over two decades of equity market experience including floor and screen-based trading, corporate access, IPOs and asset allocation. Chris is responsible for providing timely, accurate and objective market and trading-related information to Nasdaq-listed companies.
Brian Joyce, CMT is a Managing Director on the Market Intelligence Desk (MID) at Nasdaq. Before joining Nasdaq, Brian spent 16 years as an institutional trader executing equity and options orders for both the buy side and sell side. He also provided trading ideas and wrote technical analysis commentary for an institutional research offering. Brian focuses on helping Nasdaq’s Financial, Healthcare and Transportation companies, among others, understand the trading in their stock. Brian is a Chartered Market Technician (CMT).
Michael Sokoll, CFA is Associate Vice President on the Market Intelligence Desk (MID) at Nasdaq with over 25 years of equity market experience. In this role, he manages a team of professionals responsible for providing NASDAQ-listed companies with real-time trading analysis and objective market information.
The views and opinions expressed herein are the views and opinions of the author and do not necessarily reflect those of Nasdaq, Inc.
Other Topics
Stocks
The Market Intelligence Desk Team
Nasdaq
Nasdaq’s Market Intelligence Desk (MID) is designed to provide critical touch-points for timely trading analysis and market information.

MarketInsite
Nasdaq
Nasdaq’s Marketinsite offers actionable insights on a variety of market-moving topics. Learn from our thought leaders who are driving the capital markets of tomorrow.
Read MarketInsite's Bio