Summer Rally Signals: Why NDX Outperformance Points to Options Opportunities
The David Byrne Question
As a middle-aged dad to an 11-year-old boy and longtime investor and options trader, I’m often asking myself the “David Byrne question.”
Well, how did we get here?
We’re more than halfway through another calendar year. U.S. equity markets continue to perform. The Nasdaq-100 Index® (NDX®) gained 20.3% through the end of June. That compares to an S&P 500 Index® that added 10.2%.
As I’ve pointed out in the past, NDX outperformance is nothing new. The YTD spread has been driven by the performance of “technology” writ large, but more specifically, semiconductors and memory stocks.
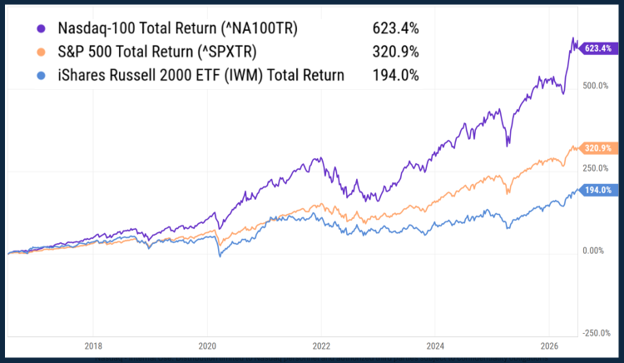
If we broaden our aperture to look back a decade, the tendency for NDX to meaningfully outperform becomes very clear. Since mid-2016, the Nasdaq-100 Index® has nearly doubled the returns of the S&P and tripled that of the small caps (as measured by IWM).
In many ways, 2026 is a microcosm of the past decade.
Or, as David Byrne might put it…Same as it ever was, same as it ever was.
My further contention is that if you’re not already using NDX index options to manage exposure, you may be leaving alpha on the table.
Source: YCharts
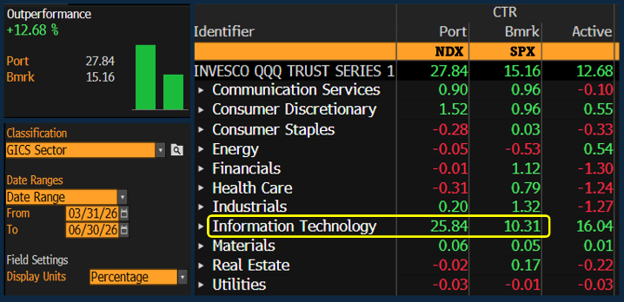
The NDX “recipe” continues to work. In Q2, NDX gained nearly 28% and the S&P added 15.2%. The visual below plots the relative outperformance, with NDX as the “portfolio” (Port) and SPY as our “benchmark.” The output is expressed in percentage points.
At the sector level, Information Technology (IT) pulled both equity indexes higher, but the rally was broad based. Energy and Utilities were slight drags on both measures.
Source: Bloomberg
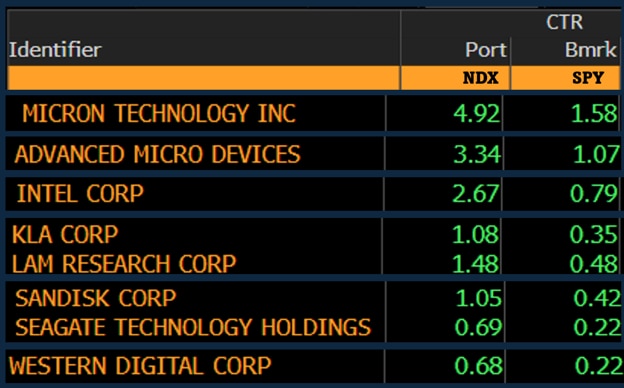
Looking under the hood at Tech specifically, Micron (MU) generated the most significant contribution to return for both NDX and SPY. However, MU elevated NDX by 4.92% and pulled SPY higher by 1.58%. Similar story in AMD, INTC, KLA, LRCX, and others.
Semis and memory names were leading the way, and those securities have greater sway in NDX when compared to alternative large cap exposure.
Source: Bloomberg
This outperformance isn’t just an equity narrative: it also creates potentially actionably opportunities in the index options market.
Correlations
As index option users know, the price of every option has an implicit expectation for future volatility. Volatility is arguably the lynchpin to successful option pricing and trading. Institutional end users and liquidity providers often quote options in volatility terms. Volatility is the variable around which their risk is managed.
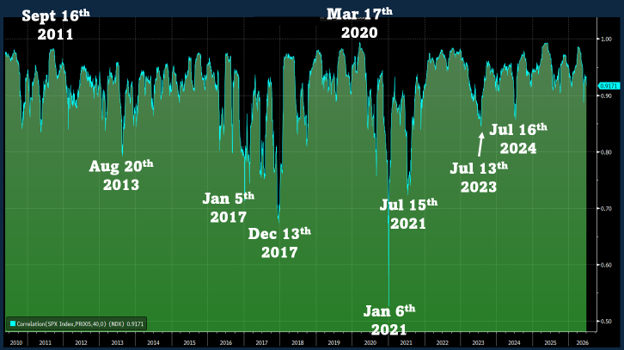
Over long time frames, NDX and SPY are very highly correlated. At present, the 50-day correlation between the two measures is 0.917, which is precisely the average correlation looking back fifteen years. The median correlation measure is 0.93.
Source: Bloomberg
In general, correlations tend to weaken during periods of significant NDX outperformance and increase during crises. The strongest correlations above occurred during the European sovereign debt crisis and the market bottom in mid-March 2020. More recently, correlations peaked during the worst of the tariff and Iran selloffs.
The clearest weakening of correlations occurred between March 2020 and early 2021 when tech names dramatically outperformed as the global economy recovered from pandemic uncertainty. During that ~9-month window, NDX outpaced SPY by nearly 25% (2500 basis points).
Storm Clouds Gathering?
That brings us to our next point about the expectation for volatility. The VIX index is a “forecast” for vol based on S&P 500 options. The VXN index uses the same methodology but NDX options as inputs. Those two measures tend to be highly correlated, with VXN almost always measuring at a premium to VIX.
That makes sense given NDX’s ~1.15 to ~1.20 beta. NDX typically moves with slightly greater velocity than the S&P. That velocity is a benefit on the way up and a detriment on the way down. In recent years, NDX has consistently exhibited more meaningful upside vol, but passive investors view that as a “high class problem.”
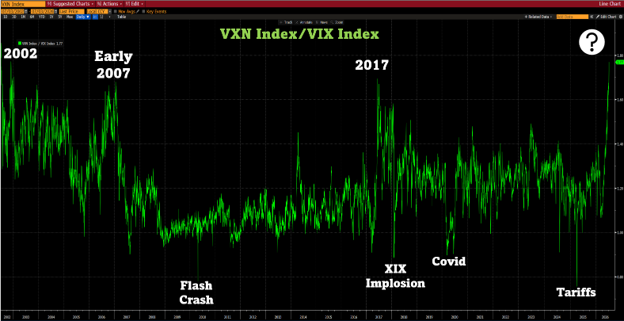
Equity indexes found support on March 30, 2026, and have been trending higher over the past three months. So, too, has the spread or volatility premium specific to NDX. Below is a long-term look at VXN divided by VIX.
On average, VXN measures 21.5% higher than VIX. The current premium (early July) is 77%. It’s the widest spread since the early aughts (specifically mid-2002). In early 2007, the ratio peaked at 68%. In June of 2017, it reached a very similar width.
Well, how did we get here?
Source: Bloomberg
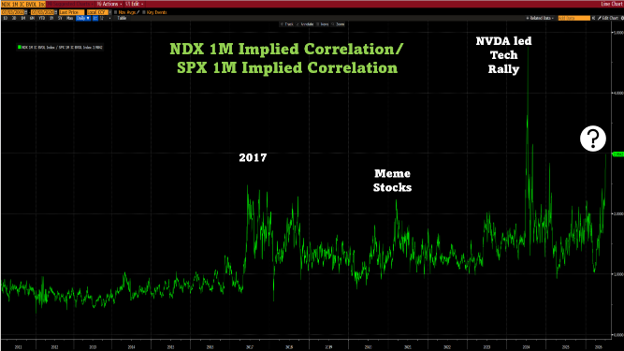
In short, NDX index options are pricing a greater degree of correlation than we observe in the S&P complex. The implied correlation spread (NDX 1M IC – SPX 1M IC) bottomed at the end of March and has been consistently expanding during the tech led recovery. Very similar dynamics occurred in mid to late 2017 and following the March 2020 bottom in equities.
Source: Bloomberg
Those periods ended with the implosion of the short volatility trade in February of 2018 (Volmaggedon) and the ARKK collapse that began in early 2021 (coinciding with the “meme stock” phenomenon).
What’s Next? What Will I Be Watching?
I have no idea what’s in store, but I know I can use index options to manage my exposure and express views where I have conviction.
I’ll be watching the reaction to SK Hynix ADR listing on Nasdaq this week. The South Korean leader, alongside Samsung, has been a highflier in the memory space.
I’m paying attention to the performance and swings in assets under management in some of the largest levered ETFs. Massive amounts of capital have flowed into (mostly) levered long exposures in recent months. Some are tethered to single name securities, others to indexes like the Nasdaq-100 Index® (TQQQ and QLD as examples).
These products are not designed as buy-and-hold vehicles. They are subject to potentially detrimental “volatility drag.” They are all (long and short) implicitly short gamma exposures. These products need to add exposure in up markets and reduce exposure in down markets which can exacerbate swings.
The ETF wrapper is a powerful one, but like anything else in capital markets, it’s imperative to understand what’s behind the wrapper. Know your risk!
I’m going to keep an eye on implied and realized correlation metrics. Single stock implied vols remain high relative to index vol. It’s partially a byproduct of a high dispersion market with varied and dynamic leadership. The big picture risk, as always, is a highly correlated selloff.
Historically, July has been a very strong month for equity performance. We’ll see what shakes out during the dog days of summer.
In the meantime, you’re getting paid more than normal to “underwrite” downside in NDX compared to the S&Ps. Is that premium justified? Time…and correlation, will tell.
NDX options are one of the most powerful tools available for managing large-cap growth exposure. Whether you’re looking to potentially protect gains (hedge), generate income, or express a directional view, the current environment is worth a closer look.
Keep asking…” how did we get here?”