
Stocks Waver as Trade Optimism Morphs to Pessimism
- NASDAQ Composite -0.07% Dow +0.05% S&P 500 -0.02% Russell 2000 -0.42%
- NASDAQ Advancers: 832 Decliners: 1517
- Today’s Volume (100 day avg) -5.52%
- Crude -1.61%, Gold +0.30%
Market Movers
- November US NAHB Housing Market Index 70 vs consensus 71. October was unrevised from 71
- The People's Bank of China cutting its seven‐day reverse repurchase rate (to 2.50% from 2.55%) for the first time since October 2015. It also injected approximately $26 billion into the financial system
- Saudi Aramco sets it’s IPO valuation at between $1.5 - $1.7 trillion less than the Kingdom’s goal of $2 trillion
- Federal Reserve speakers this week include Loretta Mester today, John Williams on Wednesday and Neel Kashkari on Thursday
Charlie’s Commentary
Trade talks continued to dominate the narrative last week. While several press reports reinforced the fact that multiple hurdles remain (including the scale of tariff relief, commitments for agricultural purchases, IP protections, and enforcement mechanisms), administration officials including White House Economic Advisor Larry Kudlow and Secretary of Commerce Wilbur Ross voiced their optimism that talks were nearing their final stages and that an agreement could be reached. That powered the markets to historic record highs on all three indexes. The S&P 500 rose +0.8% to close at 3120 , while the Dow Jones Industrial Average also climbed by +0.8% finishing at 28,004. Not to be outdone the Nasdaq Composite rose by +0.7% to close at 8540 also a record high, while the Russell 2000 strode ahead by +0.5% finishing at 1596 continued to trail its large-cap peers. The Dow notched its fourth week of consecutive gains, rising 1.2% in that time. The S&P 500 advanced 0.9% for the week, posting its sixth straight weekly gain. That’s the longest streak for the S&P 500 since 2017, when it climbed for eight straight weeks. The Nasdaq rose for a seventh consecutive week, advancing 0.8%.
This morning, optimism that was evident on Friday is on shaky ground as positive reports over the weekend were met with renewed skepticism this morning. Over the weekend Chinese state media reported that constructive talks continued with Treasury Secretary Mnuchin and US Trade Representative Lighthizer interacting with Chinese Vice Premier He regarding specific core issues necessary to complete phase one of a larger trade agreement. With some momentum evident towards reaching at least a limited trade deal, it is widely believed that some sort of agreement needs to be reached before December 15th.That is the "line in the sand" when President Trump’s next threatened tariff hikes would take place. China is now reportedly frustrated by the President recently saying that the US would not roll back tariffs after they thought both sides had agreed to that in principal.
Pretty quiet day on the with the November Home builder Sentiment the lone report. The National Association of Home Builders / Wells Fargo Housing Market Index slipped to 70 from 71 the prior month which was the fist decrease in five months (readings above 50 indicate more builders view conditions as good rather than poor). A decrease in sentiment among builders in the South, which is the largest region contributed to the November decrease. Smaller builders are hampered by a lack of lot availability and the challenge of finding skilled labor.
In the commodity pits renewed uncertainty over the 16 month trade war and concern over a glut in 2020 crude supplies despite OPEC’s willingness to extend production cuts to December is having a debilitating effect on prices today, erasing some of last week’s gains. As we have mentioned in multiple notes with the renewed uncertainty of a trade deal, gold's appeal has come back into favor as safe haven instruments provide a hedge to riskier assets such as equities.
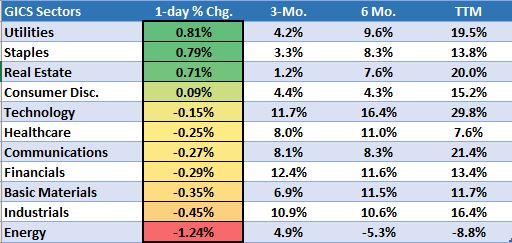
Turning to sector performance strength is evident is safe havens Utilities (+0.81%), Consumer Staples (+0.79%) and Real Estate (+0.71%). Weakness is evident in the Energy sector (-1.24%), Industrials (-0.45% and Basic Materials (-0.35%).
Economic Calendar
| Date | Time | Event |
|---|---|---|
| Monday | 10:00 a.m. | November Home Builders' Index |
| Tuesday | 8:30 a.m. | October Housing Starts |
| Tuesday | 8:30 a.m. | October Building Permits |
| Tuesday | 10:00 a.m. | Q3 Advance Services |
| Wednesday | 2:00 p.m. | FOMC Minutes |
| Thursday | 8:30 a.m. | 11/16 Weekly Jobless Claims |
| Thursday | 8:30 a.m. | November Philly Fed Index |
| Thursday | 10:00 a.m. | October Existing Home Sales |
| Thursday | 10:00 a.m. | October Leading Economic Indicators |
| Friday | 9:45 a.m. | November Markit Manufacturing PMI |
| Friday | 9:45 a.m. | November Markit Services PMI |
| Friday | 10:00 a.m. | November Consumer Sentiment Index |
Sector Recap
Brian’s Technical Take
If you thought the weekend went by too fast like I did, how about 2019, or the last decade for that matter? I won’t get crazy and go as far back as Y2K and the start of the century, but in just over six weeks’ time we will be celebrating a new year and a new decade. I enjoy the holidays as much as anyone, but come January 1st I will be up early breaking down the decorations, sweeping up the pine needles, and most likely already giving in on a resolution. On that note, 2020 brings with it a new Presidential election so maybe a “truce” with someone on the other side of the debate is worthy of a high placement on your 2020 resolution list.
In the equity markets, the semiconductor (SMH, +54%) and homebuilder (ITB, +52%) ETF’s are amongst this year’s top performing industries. Right behind them is the less popular Solar ETF (TAN) with a total return of 48%. The SMH and ITB have average daily volumes of 4.1M and 2.6M shares, vs. just 234k for the ITB.
Another glaring difference between these top performers is the recent price action. The ITB has been higher for six consecutive months, three for the SMH, while the TAN ETF has been in the red for its third consecutive month. The SMH and ITB ETF’s are within 1% and 2% of their 52-week highs, are 19% and 16% above their 200-day moving averages, and are sporting bullish daily RSI’s of 71 and 58. The TAN ETF is 15% below its 52-week high, has a 39 daily RSI, and is within 1% of its 200-day moving average.
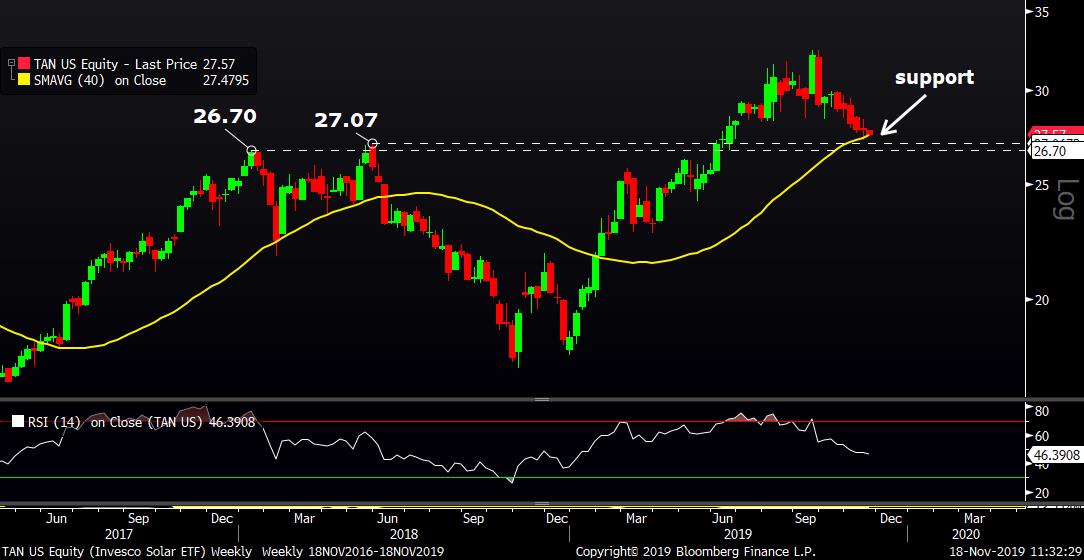
As seen in the below chart, last week the TAN ETF formed a common bottoming candlestick pattern (doji) after bouncing off its 40-week moving average, now $27.48. The 40-week is essentially synonymous with the 200-day moving average and is widely seen amongst industry technicians as a potential support line. Just 1.5% below there is the $26.70 - $27.07 support zone which represents prior highs from Q1 and Q2 2018 (“prior resistance, now support”.) The weekly RSI is now at a neutral 46 and has worked off this summer’s “overbought” 75 readings.
Those looking to deploy fresh capital into an industry with relative strength may find solar provides a more attractive entry point. As the New Year gets closer and investors look to lock in gains and roll into seemingly better opportunities (“lock and roll”), the TAN ETF could provide some nice color (excuse the pun).
Nasdaq's Market Intelligence Desk (MID) Team includes:
Charles Brown is Associate Vice President on The Market Intelligence Desk with over 20 years of equity capital markets experience. Charlie has extensive knowledge of equity trading on both floor and screen-based marketplaces. Charlie assists with the management of The Market Intelligence Desk and works with Nasdaq listed companies providing them with insightful objective trading analysis.
Steven Brown is a Managing Director on the Market Intelligence Desk (MID) at Nasdaq with over twenty years of experience in equities. With a focus on client retention he currently covers the Financial, Energy and Media sectors.
Christopher Dearborn is a Managing Director on the Market Intelligence Desk (MID) at Nasdaq. Chris has over two decades of equity market experience including floor and screen-based trading, corporate access, IPOs and asset allocation. Chris is responsible for providing timely, accurate and objective market and trading-related information to Nasdaq-listed companies.
Brian Joyce, CMT is a Managing Director on the Market Intelligence Desk (MID) at Nasdaq. Before joining Nasdaq, Brian spent 16 years as an institutional trader executing equity and options orders for both the buy side and sell side. He also provided trading ideas and wrote technical analysis commentary for an institutional research offering. Brian focuses on helping Nasdaq’s Financial, Healthcare and Transportation companies, among others, understand the trading in their stock. Brian is a Chartered Market Technician (CMT).
Michael Sokoll, CFA is Associate Vice President on the Market Intelligence Desk (MID) at Nasdaq with over 25 years of equity market experience. In this role, he manages a team of professionals responsible for providing NASDAQ-listed companies with real-time trading analysis and objective market information.
The views and opinions expressed herein are the views and opinions of the author and do not necessarily reflect those of Nasdaq, Inc.

The Market Intelligence Desk Team
Nasdaq
Nasdaq’s Market Intelligence Desk (MID) is designed to provide critical touch-points for timely trading analysis and market information.

MarketInsite
Nasdaq
Nasdaq’s Marketinsite offers actionable insights on a variety of market-moving topics. Learn from our thought leaders who are driving the capital markets of tomorrow.
Read MarketInsite's Bio