
Stocks Trade Range Bound at Record Highs
Market Movers
- November Chinese Industrial output and retail consumption grew more than expected. Industrial production jumped 6.2% from a year earlier while retail sales rose by 8%
- There are no economic releases today
- DOE reports crude oil inventories (5.47M) barrels vs consensus (1.4M) barrels
Charlie’s Commentary
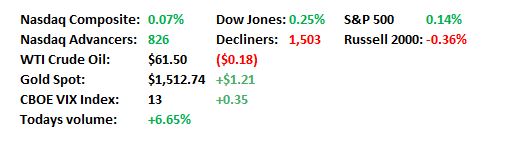
With no real new news to speak of on the trade front yesterday, traders that did make it into work were encouraged by the strong retail sales numbers during a season when there was a week less of shopping due to a late Thanksgiving Day holiday. Amazon in particular reported a “record breaking” holiday season, helping to power Nasdaq over the 9000 mark for the first time in history. Nasdaq finished +0.78 to finish at 9,022. The Dow rose +0.37 to 28,621 while the S&P 500 increased by +0.51% to 3,239. Consumer Discretionary, Communications and Technology were the leaders while Healthcare and Energy trailed.
Today’s market appears to be a continuation of the “melt up” we have been witnessing this week. The Nasdaq has risen for eleven straight sessions the best streak since 2009. It has also experienced 10 straight record closes. The Russell 2000 is at its highest level since October 2018. The S&P 500 is also hitting new highs today well within an advance of 30% for the year. That would be the indexes best return since 1997. There doesn’t appear to be any overwhelming catalyst driving the indexes higher beyond the encouraging holiday retail sales figures we saw yesterday. The consumer appears to be alive and well and that is a good sign the economy will continue to grow if one believes consumer spending is a major driver of economic growth. Investor sentiment was also boosted by a report showing a solid rebound for industrial production in China as investors look towards the completion of a Phase 1 trade deal to maintain momentum.
In the commodity space we are reminded of Gold’s strength during this time of year. While investors are familiar with the “Santa Claus” rally in equities, the shiny metal also enjoys a seasonal uplift at the end of December. In eight of the ten years this decade bullion prices have advanced between 12/23 – 1/3 with returns averaging 1.4%. It’s resiliency is best illustrated during 2013 when gold was finishing it’s worst year in 30 years. Despite that, gold managed to increase during the period surrounding the holidays. Oil has steadied to trade just under its three month highs supported by a government report showing crude inventories falling to its lowest in two months. The energy Information Administration reported that oil inventories fell 5.47 million barrels while supplies stored at Cushing Oklahoma declined to the lowest level in more than a year.
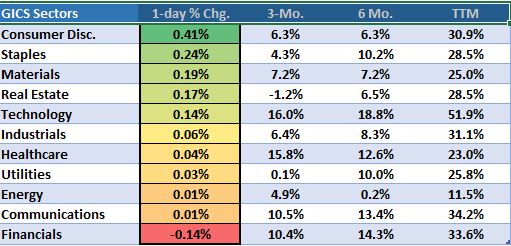
Ten of the eleven sectors are trading in positive territory lead by Consumer Discretionary (+0.41%), Staples (+0.24%) and Materials (+0.19%). Lagging are Financials (-0.14%), Communication (+0.01%) and Energy (+0.01%).
Sector Recap
Brian’s Technical Take
As we look ahead into 2020 and ponder what markets will do next, one big player in that thought process is the greenback, and more specifically, the EURUSD currency pair. Many assets have a high (inverse) correlation to the U.S. dollar given its role as the world reserve currency. Often a weak dollar/strong euro, i.e., strong EURUSD, is a tailwind for risk assets, particularly emerging markets, commodities, and large U.S. multi-national corporates.
The EURUSD is down 2.7% YTD and is a week away from cementing its fifth annual decline in six years. In 2017 the EURUSD pair gained 17% and with it the S&P 500 gained 19.4%. Accordingly, the MSCI Emerging Markets Index (MXEF) gained 34% in 2017, its best year since 2009.
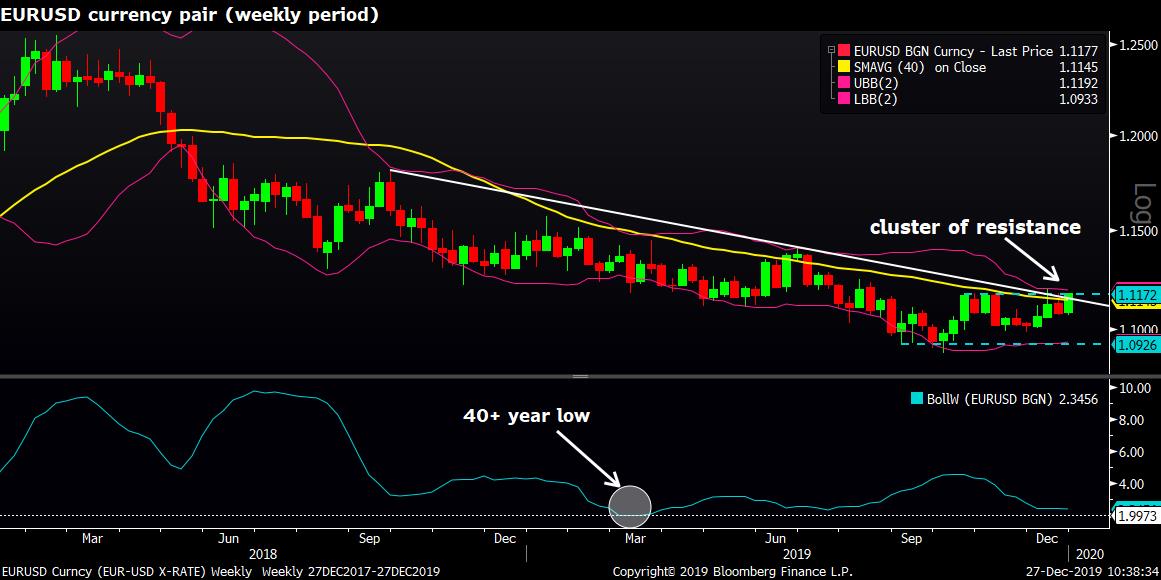
The EURUSD made its 2019 low the week ending October 4th and carved out a weekly bottoming candlestick pattern (harami). Two weeks later, in the 10/17 MIDDAY Update we highlighted the bottoming pattern and noted, “The bullish reversal was confirmed with now two consecutive weekly gains, however the easy fruit has largely been picked. The intermediate to long term trend still favors the downside. A key test is right here at the 1.112 – 1.1209 range, the top of which represents the 40-week sma (yellow line). Above this level and we can talk about the possibility that a longer lasting trend is at hand.” That conversation may now be appropriate.
Over the ensuing ten weeks to date the EURUSD has been flat as the 1.112 – 1.1209 range has acted as a formidable resistance level. Previously, this resistance represented the 40-week sma, but now it coincides with the 15-month declining trend line, as well as the highs over the prior ten weeks. It also coincides with the upper Bollinger Band (weekly period; 20, 2, 2), now 1.119. From a technical perspective this clustering of resistance increases the importance of the price level, and a breakout above it sends a strong signal that a longer lasting bullish reversal could be at hand.
The EURUSD pair is up four of the last five sessions for a weekly gain of 0.9%. Today’s 0.7% gain has it breaching above its 40-week sma, now 1.1144. Momentum is bullish with the daily RSI at 65. The weekly RSI is at a neutral 53 reading, however it is on the cusp of breaking out to 20 month highs.
Also of high importance is the EURUSD’s extremely low volatility throughout most of 2019. Back in March the spread between the upper and lower Bollinger Bands (bandwidth) reached a 40 year low, and today the bandwidth is hovering just above those lows. More recently in late November, the weekly Average True Range (ATR) reached a 23 year low. Both indicators are capturing the extreme volatility squeeze underway for quite some time now. John Bollinger notes periods of low volatility are eventually followed by periods of high volatility. High volatility does not indicate direction, but it does indicate a powerful move. Therefore, an extreme low in volatility can foreshadow a meaningful advance or decline in price. We highlighted this potential “unleashing of volatility” in the February 26th MIDDAY Update in regards to the long treasury bond ETF, ticker TLT, which then went on to gain more than 24% over the next six months.
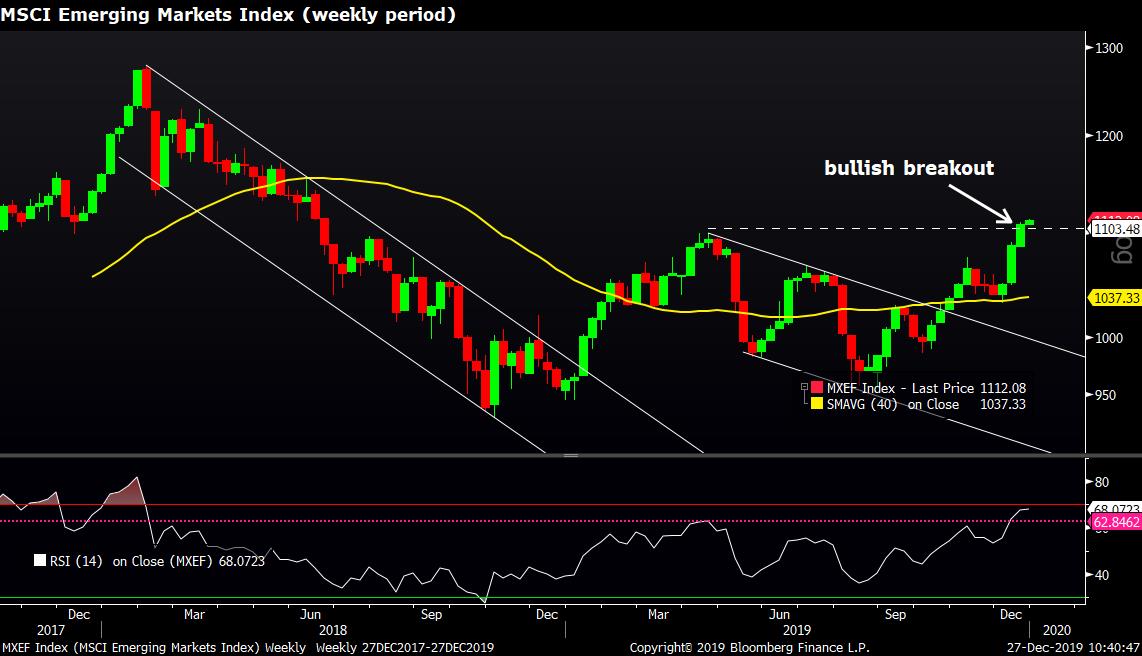
Time will tell how this plays out, but there is no question that the technical setup is there for a potentially significant move in the EURUSD pair. Bollinger uses a break of either upper or lower band is a signal a new advance is underway. As mentioned above, the upper band is now 1.119 and coincides with a large cluster of technical resistance. Thus a bullish breakout above this cluster (my bias), could potentially be the start of a powerful trend not just for the EURUSD pair, but also for assets which historically have a strong correlation (i.e. emerging markets). Note the MSCI Emerging Markets Index just last week made a bullish breakout above its prior 2019 highs previously made in April and its weekly RSI just reached a 21 month high.
While some may fear a repeat of 2019 is a low probability, I say let’s get it on.
Nasdaq's Market Intelligence Desk (MID) Team includes:
Charles Brown is Associate Vice President on The Market Intelligence Desk with over 20 years of equity capital markets experience. Charlie has extensive knowledge of equity trading on both floor and screen-based marketplaces. Charlie assists with the management of The Market Intelligence Desk and works with Nasdaq listed companies providing them with insightful objective trading analysis.
Steven Brown is a Managing Director on the Market Intelligence Desk (MID) at Nasdaq with over twenty years of experience in equities. With a focus on client retention he currently covers the Financial, Energy and Media sectors.
Christopher Dearborn is a Managing Director on the Market Intelligence Desk (MID) at Nasdaq. Chris has over two decades of equity market experience including floor and screen-based trading, corporate access, IPOs and asset allocation. Chris is responsible for providing timely, accurate and objective market and trading-related information to Nasdaq-listed companies.
Brian Joyce, CMT is a Managing Director on the Market Intelligence Desk (MID) at Nasdaq. Before joining Nasdaq, Brian spent 16 years as an institutional trader executing equity and options orders for both the buy side and sell side. He also provided trading ideas and wrote technical analysis commentary for an institutional research offering. Brian focuses on helping Nasdaq’s Financial, Healthcare and Transportation companies, among others, understand the trading in their stock. Brian is a Chartered Market Technician (CMT).
Michael Sokoll, CFA is Associate Vice President on the Market Intelligence Desk (MID) at Nasdaq with over 25 years of equity market experience. In this role, he manages a team of professionals responsible for providing NASDAQ-listed companies with real-time trading analysis and objective market information.
The views and opinions expressed herein are the views and opinions of the author and do not necessarily reflect those of Nasdaq, Inc.
Other Topics
Stocks
The Market Intelligence Desk Team
Nasdaq
Nasdaq’s Market Intelligence Desk (MID) is designed to provide critical touch-points for timely trading analysis and market information.

MarketInsite
Nasdaq
Nasdaq’s Marketinsite offers actionable insights on a variety of market-moving topics. Learn from our thought leaders who are driving the capital markets of tomorrow.
Read MarketInsite's Bio