
Stocks Slip on Disappointing Manufacturing Data
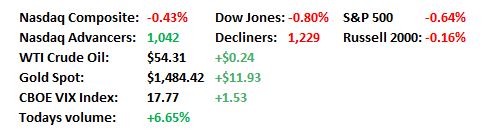
Market Movers
- ISM Manufacturing index of 47.8 was worse than the 50.0 expected and turned stocks from postive to negative
- Construction Spending grew 0.1% in August, less than the 0.5% expected.
- Weak global growth in focus today.
Mike’s Commentary
Stocks started out in decent fashion this morning, with the S&P moving within striking distance of 3,000 as a de-escalation of trade rhetoric (China buying more soybeans) and a selloff in bonds brought the Dow back above 27,000 and the S&P to 2,995.
Things were setting up pretty well until the ISM manufacturing number that we previewed yesterday hit the wires. The release was much worse than expected at 47.8 vs. the 50.0 expectation, indicating not only contraction but the worst since June 2009. That caused a bond rally and a sharp drop in stocks to the current -224 reading on the Dow. Construction spending also rose only 0.1% vs. the 0.5% estimate.
The weaker than expected US data reminded investors (and trading algorithms) that global growth is slowing. The WTO cut its outlook for global trade to the lowest in a decade, Eurozone PMI's have been a mess – the lowest since October 2012 and oil has been trending down on the outlook. The WSJ had an article that the Midwest economy is under pressure and the ISM number seemed to confirm all of that. This puts a lot more importance on the jobs report later this week as it’s been a bright spot for the economy.
Outside of today’s ISM data point, the Bank Of Japan’s announcement that it would buy more hedged foreign debt and less domestic debt, had bonds selling off since the development, in concert with BOJ tapering and some poor Japanese bond auctions had investors thinking that the push to negative yields may have abated, a positive signal for stocks. We’ll see that this means long term, especially since Australia is easing further. For more, see Brian’s technical take.
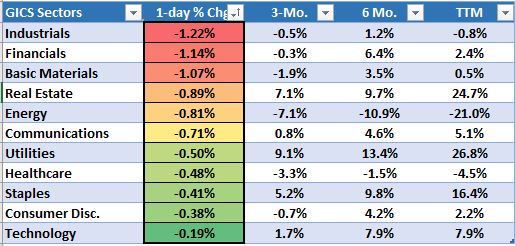
In sector performance, Industrials, Financials and Materials are the weakest so far, each dropping more than 1% on the day after taking cues from the ISM number. The S&P 500 Industrials chart looks like one of those cliffs you’d see watching Wile E. Coyote just before the Roadrunner handed him an Anvil, and the rest of the charts don’t look that much better. All sectors are in the red, with IT faring the least worse, down only about 0.2%.
Stocks are still up 18% for the year so far, so take heart…
Sector Recap
Brian’s Technical Take
Japanese bond futures sank the most in three years following tepid demand at today’s 10-year debt auction. European and US Treasuries followed suit after the Bank of Japan signaled it could slash bond purchases in October, and separately there was an announcement that Japan’s Government Pension Investment Fund will pivot towards buying more foreign debt.
The total amount of negative yielding bonds peaked just north of $17T in late August, 90% of which are located in Europe and Japan. Accordingly, their banking systems have been struggling in this environment of negative rates and flat spreads as seen in the primary bank indices which are at or near multi-decade lows. If today’s announcement is the first step in a pivot away from the legacy stimulus policies of deeper negative rates, then that should bode well for banks.
Japan’s Topix Bank Index (TPNBNK) is flat on the year after declining 26.5% in 2018. Over the last five years it has a total return of -7.3% while its U.S. counterpart, the KBW BKX Index, achieved a total return of more than 57%.
After a relief rally in early September the Topix bank Index has spent the last two weeks consolidating along the 40-week sma (synonymous with the 200-day sma), which it has proven to be sensitive to on numerous occasions, as both resistance and support, over the last five years. More recently since the start of 2018 the 40-week sma has been a clearly defined resistance line. A breakout above this level this time around may indicate this time is different and a new upside trend is underway.

Nasdaq's Market Intelligence Desk (MID) Team includes:
Charles Brown is Associate Vice President on The Market Intelligence Desk with over 20 years of equity capital markets experience. Charlie has extensive knowledge of equity trading on both floor and screen-based marketplaces. Charlie assists with the management of The Market Intelligence Desk and works with Nasdaq listed companies providing them with insightful objective trading analysis.
Steven Brown is a Managing Director on the Market Intelligence Desk (MID) at Nasdaq with over twenty years of experience in equities. With a focus on client retention he currently covers the Financial, Energy and Media sectors.
Christopher Dearborn is a Managing Director on the Market Intelligence Desk (MID) at Nasdaq. Chris has over two decades of equity market experience including floor and screen-based trading, corporate access, IPOs and asset allocation. Chris is responsible for providing timely, accurate and objective market and trading-related information to Nasdaq-listed companies.
Brian Joyce, CMT is a Managing Director on the Market Intelligence Desk (MID) at Nasdaq. Before joining Nasdaq, Brian spent 16 years as an institutional trader executing equity and options orders for both the buy side and sell side. He also provided trading ideas and wrote technical analysis commentary for an institutional research offering. Brian focuses on helping Nasdaq’s Financial, Healthcare and Transportation companies, among others, understand the trading in their stock. Brian is a Chartered Market Technician (CMT).
Michael Sokoll, CFA is Associate Vice President on the Market Intelligence Desk (MID) at Nasdaq with over 25 years of equity market experience. In this role, he manages a team of professionals responsible for providing NASDAQ-listed companies with real-time trading analysis and objective market information.
The views and opinions expressed herein are the views and opinions of the author and do not necessarily reflect those of Nasdaq, Inc.
Other Topics
Stocks
The Market Intelligence Desk Team
Nasdaq
Nasdaq’s Market Intelligence Desk (MID) is designed to provide critical touch-points for timely trading analysis and market information.

MarketInsite
Nasdaq
Nasdaq’s Marketinsite offers actionable insights on a variety of market-moving topics. Learn from our thought leaders who are driving the capital markets of tomorrow.
Read MarketInsite's Bio