
Stocks Fluctuate on Trade Talk Reports
- NASDAQ Composite -0.05% Dow +0.11% S&P 500 +0.02% Russell 2000 -0.15%
- NASDAQ Advancers: 961 Decliners: 1233
- Today’s Volume (vs. Friday) -38.5%
- Crude $53.16 -$1.54, Gold $1487.60 +$4.90, VIX 14.97 -0.61
Market Movers
- Bond market closed for Columbus Day Holiday
- China September trade came in softer than expected
- Brexit negotiations concerns
Chris’ Commentary
Major indexes finished higher last week following positive comments on Friday around China-U.S. trade discussions. The S&P 500 snapped a three week losing streak, closing at 2970.40 which is less than 2% form the all-time high made at the end of July. For the week, the S&P 500 was up 0.61%, the Dow was up 0.91%, the Nasdaq was up 0.93% and the Russell 2000 closed higher by 0.75%.
Equity markets are open for trading while bond markets and banks are closed for Columbus Day. Expect today’s trading volumes to be light as a number the usual market participants take the day off.
Stocks opened near the lows of the day following comments out of China that put a dampener on Friday’s positive momentum. Bloomberg reported that China wants more talks to work out some of the details before signing the “phase 1” trade deal which President Trump touted at the end of last week. Treasury Secretary Mnuchin then came on TV today and stated that he expects that there will be a deal as both sides made “substantial Progress” in last week’s negotiations. This was enough to rally the major indexes back to relatively flat at midday.
Currently, 4 of the 11 of the S&P 500 sectors are trading higher with Tech, Financial and Healthcare leading. Crude oil is lower. Gold and the dollar both move higher at this hour.
Trading volumes on the consolidated tape last week were some of the lightest of the year. Even with Friday’s high volume rally, the weekly average was only 6.35 billion shares, well below the 7.06 billion shares a day average for 2019. The lack of conviction, as indicated by the light trading volumes, tells you that investors are sitting on the sideline awaiting firm details of a trade deal despite the encouraging comments made Friday.
Third quarter earnings will be getting underway in earnest this week with many of the big banks set to report. We will also get a good look at Tech, Healthcare, Transports and Media names. We have 50 of the S&P 500 names set to report and this should give us a good look at state of business these past three months. Here’s what the earnings calendar looks like for the week: BLK, C, FRC, GS, JNJ, JPM, OMD, PLD, SCHW, UNH, WFC (Tuesday morning); JBHT, UAL (Tuesday night); ABT, BAC, BK, CMA, PGR, PNC, USB (Wednesday morning); AA, CCI, CCK, CSX, IBM, KMI, NFLX, SLG, URI (Wednesday night); BBT, DOV, GPC, HON, KEY, MS, MTB, PM, PPG, SNA, STI, TXT, UNP (Thursday morning); ETFC, ISRG, PBCT (Thursday night); and AXP, CFG, KO, KSU, SLB, STT and SYF (Friday morning).
Economic Calendar
| Date | Time | Event |
|---|---|---|
| Tuesday | 7:45 | Retail Economist/Goldman Chain Store |
| Tuesday | 8:30 | Empire Manufacturing |
| Tuesday | 8:55 | Redbook Chain Store |
| Tuesday | 16:30 | API Crude Inventories |
| Wednesday | 7:00 | MBA Mortgage Purchase Applications |
| Wednesday | 8:30 | Retail Sales |
| Wednesday | 8:30 | Retail Sales ex Autos |
| Wednesday | 10:00 | Business Inventories |
| Wednesday | 10:00 | NAHB Housing Market Index |
| Wednesday | 10:30 | DOE Crude Inventories |
| Wednesday | 16:00 | TIC Flows |
| Thursday | 8:30 | Initial Jobless Claims |
| Thursday | 8:30 | Continuing Claims |
| Thursday | 8:30 | Housing Starts |
| Thursday | 8:30 | Philadelphia Fed Index |
| Thursday | 9:15 | Industrial Production |
| Thursday | 9:15 | Capacity Utilization |
| Thursday | 10:30 | EIA Natural Gas Inventories |
| Friday | 10:00 | Leading Indicators |
Sector Recap

Brian’s Technical Take
Brian is out today, so the task of the Technical Take comes to me.
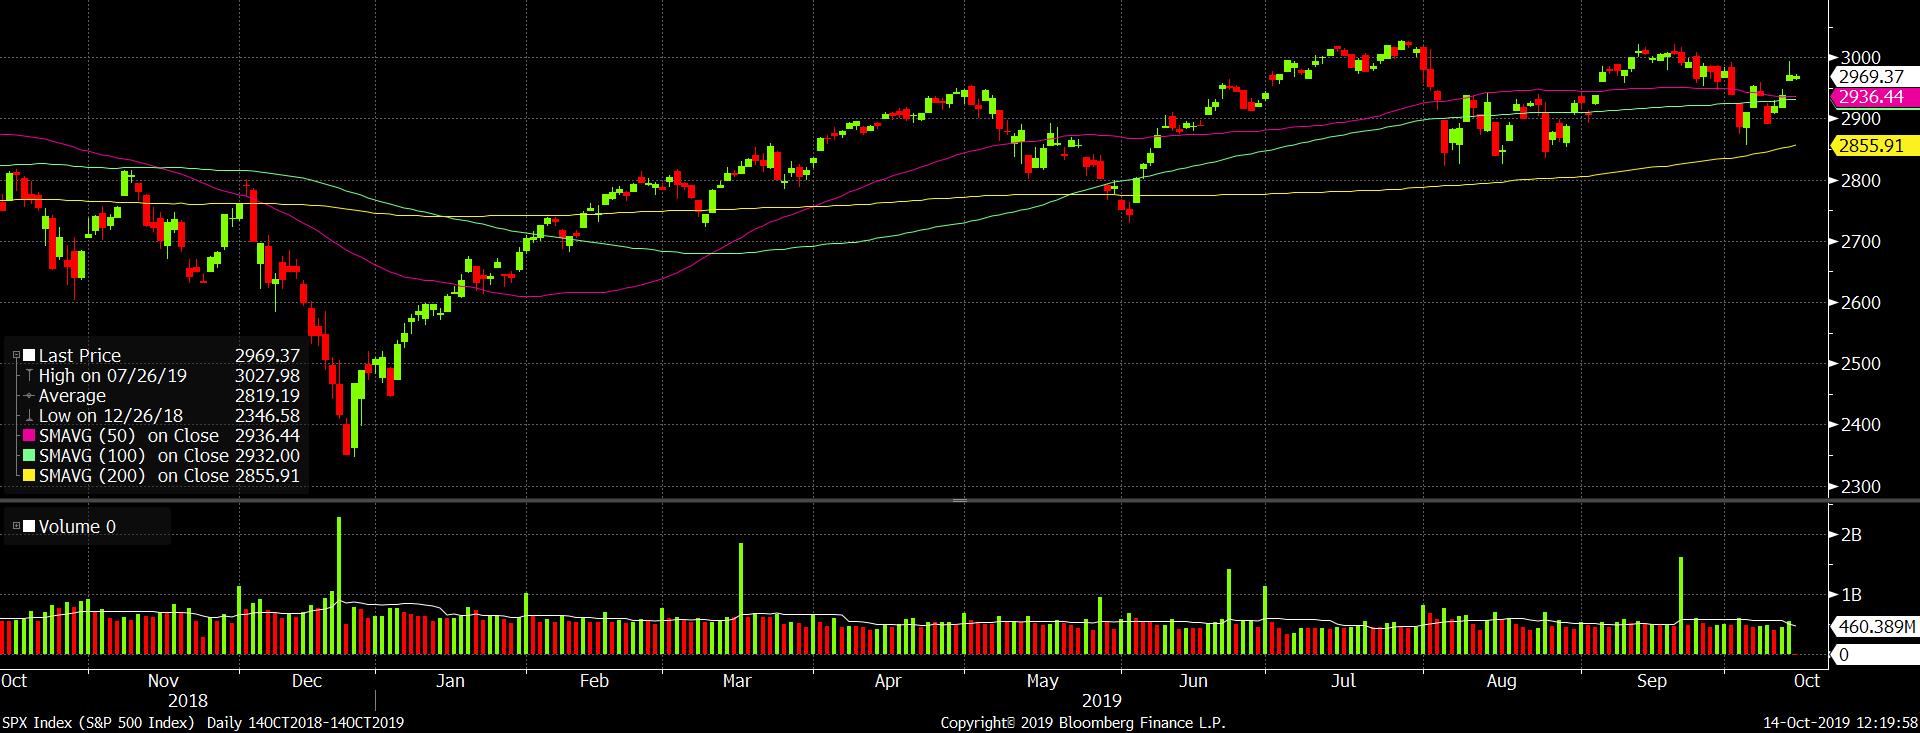
Much has been written on the S&P 500 and with the index trading near all-time highs it thought it would be good to highlight the some major levels for today’s chart. The index is trading above all major SMAs and look for these areas to provide support for the index on any pullback. The 50 and 100 day SMAs sit closely together at 2936 and 2931 respectively while the 200 day trails at 2855. If the index continues to find support here, then that should bode well for the broader market.
Nasdaq's Market Intelligence Desk (MID) Team includes:
Charles Brown is Associate Vice President on The Market Intelligence Desk with over 20 years of equity capital markets experience. Charlie has extensive knowledge of equity trading on both floor and screen-based marketplaces. Charlie assists with the management of The Market Intelligence Desk and works with Nasdaq listed companies providing them with insightful objective trading analysis.
Steven Brown is a Managing Director on the Market Intelligence Desk (MID) at Nasdaq with over twenty years of experience in equities. With a focus on client retention he currently covers the Financial, Energy and Media sectors.
Christopher Dearborn is a Managing Director on the Market Intelligence Desk (MID) at Nasdaq. Chris has over two decades of equity market experience including floor and screen-based trading, corporate access, IPOs and asset allocation. Chris is responsible for providing timely, accurate and objective market and trading-related information to Nasdaq-listed companies.
Brian Joyce, CMT is a Managing Director on the Market Intelligence Desk (MID) at Nasdaq. Before joining Nasdaq, Brian spent 16 years as an institutional trader executing equity and options orders for both the buy side and sell side. He also provided trading ideas and wrote technical analysis commentary for an institutional research offering. Brian focuses on helping Nasdaq’s Financial, Healthcare and Transportation companies, among others, understand the trading in their stock. Brian is a Chartered Market Technician (CMT).
Michael Sokoll, CFA is Associate Vice President on the Market Intelligence Desk (MID) at Nasdaq with over 25 years of equity market experience. In this role, he manages a team of professionals responsible for providing NASDAQ-listed companies with real-time trading analysis and objective market information.
The views and opinions expressed herein are the views and opinions of the author and do not necessarily reflect those of Nasdaq, Inc.
Other Topics
Stocks
The Market Intelligence Desk Team
Nasdaq
Nasdaq’s Market Intelligence Desk (MID) is designed to provide critical touch-points for timely trading analysis and market information.

MarketInsite
Nasdaq
Nasdaq’s Marketinsite offers actionable insights on a variety of market-moving topics. Learn from our thought leaders who are driving the capital markets of tomorrow.
Read MarketInsite's Bio