

JUNE 2026 MARKET UPDATE
By Steve Lowe
06/05/2026
Thrivent Asset Management contributors to this report: John Groton, Jr., CFA, director of equity administration and materials & energy research and Charles Hofstrom, CFA, investment product manager
May’s benchmark returns

What mattered in May
The economy: Economic data released in May was broadly supportive, showing a rebound in industrial production, strong corporate earnings, stronger employment and robust consumption. However, consumer confidence continued to slide while oil prices remained high (until near the end of the month) and inflation continued to climb.
Stocks: Geopolitical uncertainty again took a back seat to strong first-quarter earnings growth in May. In the U.S., earnings have risen substantially year over year (up approximately 30%), and while the technology sector was a primary driver of this growth, earnings growth (excluding technology) has been solid and broad based at around 10%. Equities were supported by renewed optimism over the potential productivity gains artificial intelligence (AI) could produce, the impact of the massive capital spending required to achieve those gains and optimism that the conflict in the Middle East would de-escalate.
Bonds: Treasury yields were more sensitive to the conflict in the Middle East, oil price volatility and rising inflation. The 30-year Treasury bond yield rose to levels not seen since before the Global Financial Crisis, hitting a high near 5.2% before retreating to near 5.0% as oil prices fell late in the month. The Bloomberg U.S. Aggregate Bond Index, which is predominantly comprised of Treasuries, investment-grade corporate bonds and U.S. mortgage-backed securities, rose 0.31% in May.
How it changes our outlook:
The economy: We expect the economy to continue to find support from strong corporate earnings, AI-related capital spending, a relatively low unemployment rate, resilient consumers, tax cuts, deregulation and an expansionary fiscal policy. A de-escalation of the conflict in the Middle East remains key to investor optimism, and the ability of AI to deliver productivity gains remains a risk should AI not live up to lofty expectations. However, demand for AI remains strong and companies are increasingly implementing and integrating AI.
- Our base case remains that growth will remain solid, propelled in part by a surge of capital spending on artificial intelligence
Stocks: We are modestly overweight equities versus fixed income based on our positive long-term outlook and emphasis on fundamentals and earnings. However, the potential for renewed uncertainty and volatility stemming from the conflict in the Middle East warrants caution. We continue to favor U.S. stocks over international equities and retain our neutral outlook on emerging-market equities.
- Maintain exposure, favoring an overweight to large-cap stocks and a moderate overweight to mid-cap stocks. We also have a modest overweight to small-caps that includes private equity exposure, along with a slight underweight to public small-cap stocks
Bonds: The conflict in the Middle East can still pressure interest rates in opposite directions. A de-escalation in the conflict could allow oil prices to decline further, reducing upward pressure on inflation, while sustained conflict could push oil prices higher, fueling inflation and pushing Treasury yields higher. However, in the event the conflict persists, a sustained increase in oil prices could eventually dampen consumer spending and the economy, pressuring rates lower. As such, we are moderately overweight interest rate exposure (duration) mainly through the long end of the Treasury rate curve as a hedge should the economy slow due to rising energy costs.
- Maintain exposure to Treasuries and favor higher-quality corporate bonds with less exposure to macroeconomic weakness
May’s key economic data
First-quarter gross domestic product (GDP) was revised down from 2.0% to 1.6%, with growth in consumer spending revised down from 1.6% to 1.4%. April U.S. industrial production rose 0.7%, the most in more than a year, and a rebound from the revised 0.3% drop in March. The Institute for Supply Management (ISM) Manufacturing Purchasing Managers’ Index (PMI) for May also rose by 1.3 points to 54, helped by strong growth in new orders.

Consumer confidence keeps falling
The University of Michigan’s Consumer Sentiment Index fell 5 points to 44.8 in May, another record low and below consensus expectations. Retail sales rose 0.5% in April, its third consecutive rise, while U.S. consumer spending rose 0.5%. However, inflation-adjusted disposable income continued to decline, falling 0.5% in April, and the personal savings rate fell to 2.6% in April, down from 3.2% in March and 5.8% a year ago.
Employment data strengthened
The Bureau of Labor’s May employment report, released on June 5, was stronger than expected, with 172,000 new jobs added over the month. This was well above expectations, which generally ranged between 80,000 and 88,000 new jobs. Revisions to the prior two months were also significant, with employment revised higher by 29,000 jobs in March (from 185,000 to 214,000) and 64,000 jobs in April (from 115,000 to 179,000). The unemployment rate was unchanged at 4.3%, as generally expected, while average hourly earnings rose 0.3% from April and 3.4% from May 2025. The strong employment data confirmed other private measures of the labor market, such as ADP’s payroll report, which indicated a strengthening trend in job creation.
Inflation keeps rising
April’s Core Consumer Price Index (CPI) rose 2.8% from April of last year, while headline CPI (which includes the more volatile food and energy sectors) rose 3.8%, its largest rise since 2024, fueled by higher gas prices as well as large increases in grocery prices and rents. The Producer Price Index (PPI) for April rose more than consensus expectations, at 6.0% year over year, and Core PPI, which excludes food and energy, rose 5.2%. April’s Core Personal Consumption Expenditures (PCE) Price Index, which has been the Fed’s preferred measure of inflation, continued to climb, rising 0.2% relative to March and 3.3% relative to April 2025, in line with consensus expectations.

How key markets responded
U.S. stocks rose
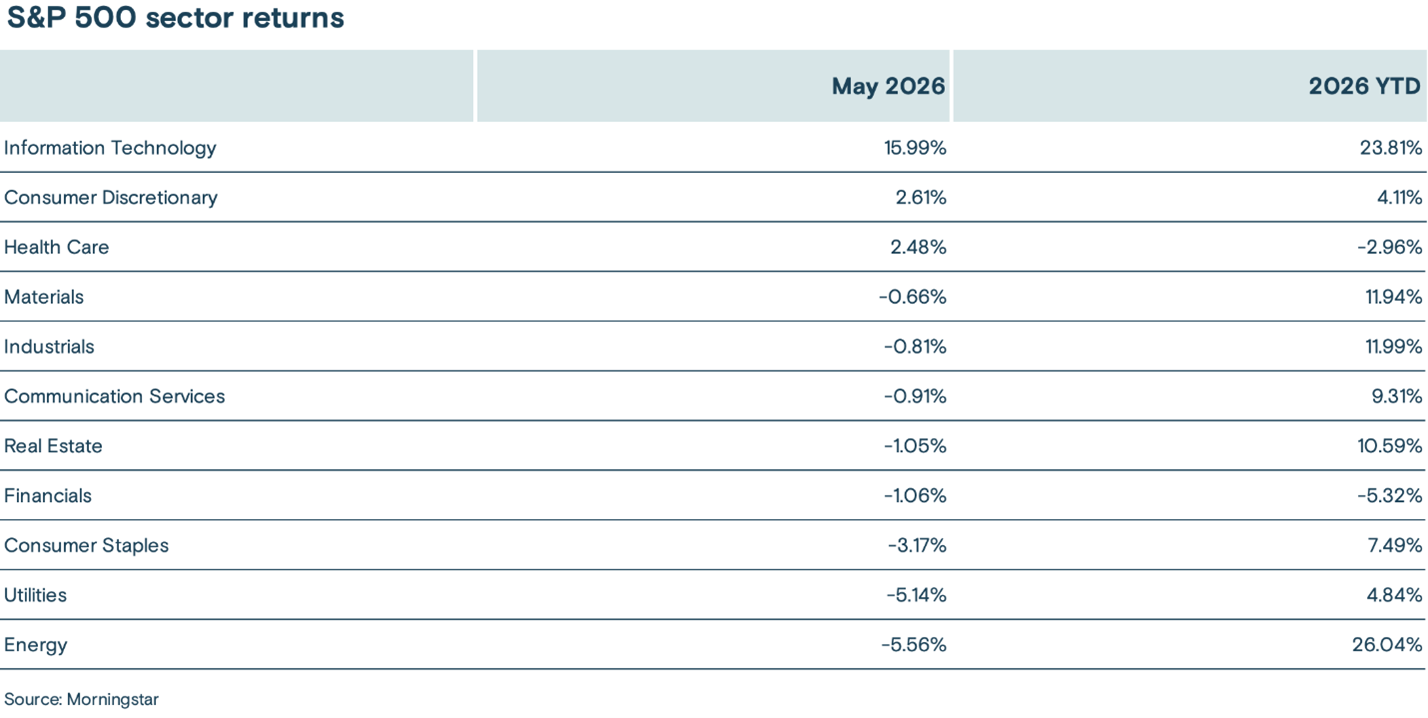
The S&P 500 Index of large-cap stocks rose 5.15% in May, setting 11 new all-time highs and bringing its year-to-date return to 10.73%. The strong performance was largely due to positive earnings, particularly in the technology sector, and renewed enthusiasm for AI productivity benefits. The information technology sector (up 15.99%) led the index higher, while the tech-heavy Nasdaq Composite Index posted strong performance, rising 8.36% over the period. The Russell 2000 Index of small-cap stocks rose 4.27% in May.

The table below shows the past month and year-to-date performance results of the 11 sectors:
International equities rose
The MSCI ACWI ex-USA Index, which tracks stocks across developed and emerging-market economies across the world (excluding the U.S.), rose 4.68% in May, marginally underperforming the S&P 500 Index. Emerging-market countries again led the index higher, driven by Taiwan and South Korea, which benefited from their significant role in the semiconductor supply chain. At one point during the period, South Korea’s KOSPI Index was up 100% for 2026. Positive economic data in Japan helped boost Japanese equities (up 6.2%), while eurozone countries generally underperformed.

Treasury yields were volatile
Benchmark 10-year Treasury yields rose 0.05% over the period, from 4.39% at the end of April to 4.44% at the end of May. Concerns about higher energy prices and inflation pressures pushed yields significantly higher during the period, with yields on 30-year Treasury bonds reaching their highest level in nearly 20 years. However, falling oil prices late in the month helped relieve inflation concerns, allowing yields to fall sharply into month end. The market continues to expect interest rates to remain unchanged at the U.S. Federal Reserve’s (Fed) June meeting, while expectations for rate hikes in late 2026 and early 2027 rose over the period.

Investment-grade credit strengthened
Investment-grade corporate bond yield spreads (the amount of yield paid over comparable U.S. Treasuries) continued to tighten in May, supported by solid corporate fundamentals and steady demand for corporate bonds. The Bloomberg U.S. Aggregate Bond Index rose 0.31% in May, bringing its year-to-date return to 0.38%.
The U.S. dollar rose
The Nominal Broad Trade-Weighted U.S. Dollar Index rose 0.21% in May, supported by increasing expectations for higher U.S. interest rates. In April, Japan intervened to support the yen against the U.S. dollar, but these gains were largely unwound in May as the country’s core inflation data fell to a four-year low, suggesting Japanese interest rates may rise more slowly.

Commodity prices fell
The S&P GSCI Index (a broad-based and production-weighted index representing the global commodity market) fell 9.61% in May as optimism grew for a de-escalation of the conflict in the Middle East and the reopening of the Strait of Hormuz. The cost of a barrel of West Texas Intermediate (a grade of crude oil used as a benchmark in oil pricing) fell 16.86% over the month to $87.36.

________________________________________
Media contact: Callie Briese, 612-844-7340; callie.briese@thrivent.com
All information and representations herein are as of 6/05/2026, unless otherwise noted.
The views expressed are as of the date given, may change as market or other conditions change, and may differ from views expressed by other Thrivent Asset Management, LLC associates. Actual investment decisions made by Thrivent Asset Management, LLC will not necessarily reflect the views expressed. This information should not be considered investment advice or a recommendation of any particular security, strategy or product. Investment decisions should always be made based on an investor's specific financial needs, objectives, goals, time horizon, and risk tolerance.
The S&P 500 is a market-cap-weighted index that represents the average performance of a group of 500 large capitalization stocks.
The Russell 2000 Index is an unmanaged index considered representative of U.S. small-cap stocks. The
The Nasdaq Composite Index is a stock market index that includes almost all stocks listed on the Nasdaq stock exchange. The Nasdaq – National Association of Securities Dealers Automated Quotations – is an electronic stock exchange with more than 3,300 company listings.
MSCI ACWI ex USA Index is an unmanaged index considered representative of large- and mid-cap stocks across developed and emerging markets, excluding the U.S.
The Bloomberg U.S. Aggregate Bond Index is an unmanaged index considered representative of the U.S. investment-grade, fixed-rate bond market.
The Federal Funds effective rate is the interest rate at which depository institutions (mainly banks) lend reserve balances to other depository institutions overnight on an uncollateralized basis. In simpler terms, it's the rate banks charge each other for short-term loans to meet their reserve requirements.
The Institute for Supply Management Manufacturing Purchasing Managers Index (PMI) measures the month-over-month change in economic activity within the manufacturing sector.
The University of Michigan Consumer Sentiment Index is a consumer confidence index published monthly by the University of Michigan.
Core Consumer Price Index measures the monthly change in prices paid by U.S. consumers for a basket of goods and services, excluding food and energy prices.
Consumer Price Index measures the monthly change in prices paid by U.S. consumers for a basket of goods and services.
Core Producer Price Index (PPI) measures the average change in selling prices received by domestic producers for their output, strictly excluding food and energy prices.
Producer Price Index (PPI) is a monthly economic indicator that measures the average change over time in the selling prices received by domestic producers for their output.
Core Personal Consumption Expenditures (PCE) Price Index, also known as consumer spending, is a measure of the spending on goods and services, excluding food and energy prices, by people of the U.S.
The Nominal Broad Trade-weighted U.S. Dollar Index measure the value of the U.S. dollar based on its competitiveness versus trading partners.
The KOSPI (Korea Composite Stock Price Index) is the benchmark stock market index of all common shares traded on the primary board of the Korea Exchange (KRX).
Any indexes shown are unmanaged and do not reflect the typical costs of investing. Investors cannot invest directly in an index.
Thrivent Distributors, LLC is a registered broker-dealer and member FINRA.
Past performance is not necessarily indicative of future results.
Latest articles

This data feed is not available at this time.
Data is currently not available