
David Tsoi, CFA, CAIA, FRM, CESGA, CAMS, Head of Index Research, APAC
- 86% of Nasdaq-100 firms by index weight topped analysts’ earnings estimates in Q3. Quarterly sales for all Magnificent 7 companies surpassed consensus estimates. Recent tech earnings underscore AI’s structural growth, as leading players signaled a sharp rise in capital expenditures (capex) amid broad-based demand for AI and its infrastructure. Accelerating cloud revenue across major platforms further strengthens confidence in AI’s monetization prospects. Amazon, Microsoft and Google collectively captured 63% of enterprise cloud infrastructure spending in Q3, up from 61% two years ago. While the current AI investment surge is notable, its scale relative to GDP remains below that of the late-1990s tech boom and the 19th-century railroad expansion.

Source: Bloomberg.
- The chart below highlights how resilient fundamentals, particularly profit growth, have mostly aligned with stronger equity performance among major Nasdaq-100 constituents this year.

- The Nasdaq-100 delivered 17% year-over-year net income growth in the third quarter, marking the tenth straight quarter of expansion above 15% and outperforming the S&P 500. Notably, the technology sector led with 23% growth, the highest among all ICB industries within the Nasdaq-100, reinforcing its leadership role in driving overall performance.
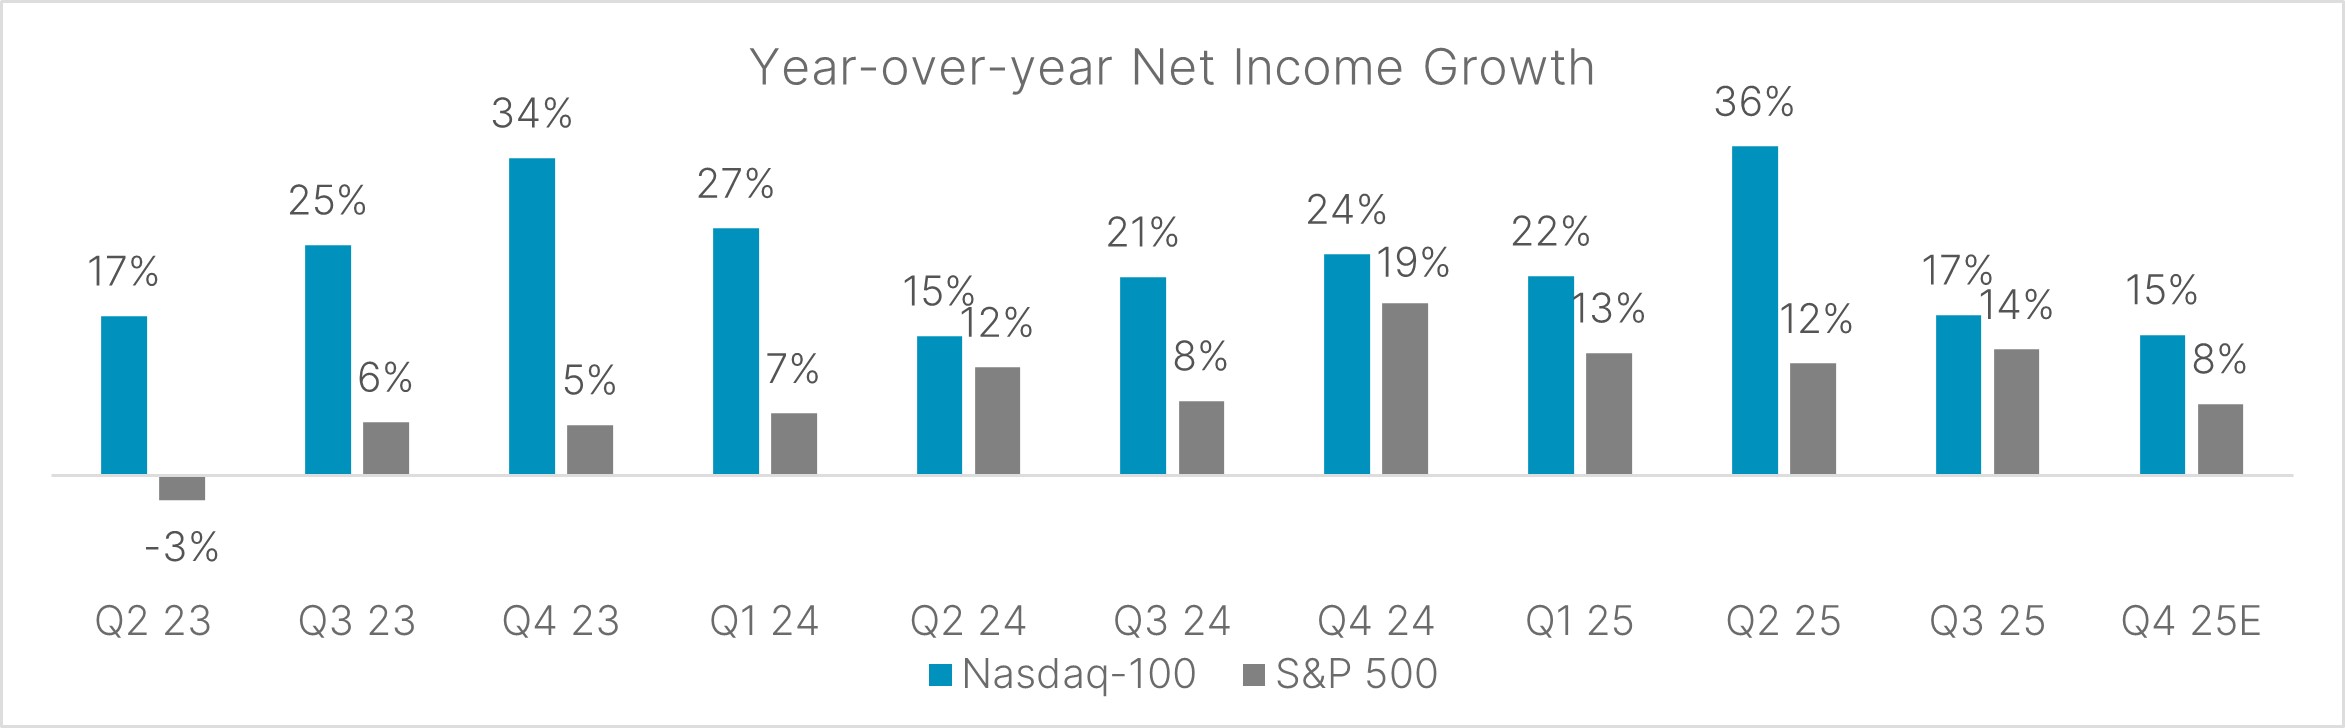
Source: FactSet. Data as of December 15, 2025.
Q3 Earnings Update for Major Nasdaq-100 Constituents
- Nvidia issued a robust revenue outlook and dismissed concerns of an AI bubble, alleviating sector-wide jitters. The company projects about US$65 billion in current-quarter sales, roughly US$3 billion above consensus, and anticipates gross margin reaching 75%. It sees visibility to US$500 billion in combined Blackwell and Rubin revenue for 2025 and 2026, with potential upside from incremental deals. Q3 revenue exceeded estimates, climbing 62% to US$57.0 billion. Nvidia also plans to invest up to US$10 billion in Anthropic. The deal anchors Nvidia’s technology within another leading player driving AI’s integration into everyday life.
- Microsoft’s quarterly revenue climbed 18% to US$77.7 billion, topping consensus estimates. Azure and other cloud services delivered 40% year-over-year sales growth, beating Wall Street expectations. Demand continued to outpace supply across workloads despite increased capacity during the quarter. The company now counts 900 million monthly active users of AI features across its products. Fueled by accelerating demand for its cloud and AI offerings, Microsoft invested US$34.9 billion in capex, including leases, in Q3.
- Apple’s Q3 revenue rose 8% to US$102.5 billion, modestly ahead of consensus. iPhone sales gained 6% to US$49.0 billion, slightly below analyst projections. The quarter featured roughly two weeks of iPhone 17 availability, with initial demand signaling robust consumer interest. Supply constraints weighed on Greater China, where revenue declined 4% to US$14.5 billion. Management anticipates a sharp rebound this quarter, with China returning to growth and total sales rising 10% to 12%, pointing to the strongest holiday season in years. Services remain a key growth driver, with revenue up 15% to US$28.8 billion. Tariff-related costs totaled US$1.1 billion in Q3, in line with Apple’s expectations.
- Amazon’s quarterly revenue and profit rose 13% and 38%, respectively, both surpassing consensus estimates. Amazon Web Services (AWS) delivered a 20% sales increase to US$33 billion, its strongest year-over-year growth since the launch of ChatGPT in late 2022, despite lagging Microsoft Azure and Google Cloud in growth rate. The upside beat underscores AWS’s resilience, further reinforced by a US$38 billion, seven-year agreement to supply OpenAI with Nvidia GPUs, highlighting its capability to scale massive data center networks. Core retail operations remained solid, with online store sales up 10% to US$67.4 billion and third-party seller services advancing 12% to US$42.5 billion. Management projects full-year capex to reach approximately US$125 billion in 2025.
- Broadcom posted 28% revenue growth in the quarter, reaching US$18.0 billion. Semiconductor sales surged 35% to US$11.1 billion, representing 61% of total revenue. Growth was driven by AI chip revenue of US$6.5 billion, up 74% year-on-year. Infrastructure software revenue climbed 19% to US$6.9 billion, supported by strong uptake of VMware Cloud Foundation. Management noted that gross margins will face pressure through the year due to a higher AI revenue mix. The company holds a US$73 billion AI backlog for delivery over the next 18 months, including US$21 billion in orders from Anthropic for Google’s custom Ironwood chips.
- Meta’s Q3 revenue jumped 26% to US$51.2 billion, beating analyst expectations and underscoring the strength of its core advertising business, which accounts for 98% of total revenue. The average price per ad rose 10% year-over-year, supported by stronger advertiser demand largely driven by improved ad performance. Meta’s family of apps reached an average of 3.54 billion daily active users in September 2025, up 8% from a year ago. The company raised the lower end of its 2025 capex forecast by US$4 billion, setting a range of US$70 billion to US$72 billion. Meta also recorded a one-time, non-cash income tax charge of US$15.9 billion in Q3 related to the implementation of the One Big Beautiful Bill Act. Additionally, it completed a US$30 billion bond sale, the largest high-grade U.S. note issuance since 2023.
- Alphabet, Google’s parent company, posted strong Q3 results with revenue up 16% year-over-year to US$102.3 billion. Cloud sales surged 34% to US$15.2 billion, reinforcing its position as Alphabet’s fastest-growing segment and a clear beneficiary of the AI boom. Cloud backlog climbed 46% quarter-over-quarter to US$155 billion, providing solid visibility into future demand. Google Search, the engine behind Alphabet’s advertising dominance, delivered 15% growth, successfully fending off rising competition from AI chatbots. Investments in new AI features, such as AI Overviews and AI Mode, continue to boost overall queries. The company processed over 1.3 quadrillion tokens in October, marking more than 20-fold growth year over year. Capex are now projected at US$91 billion to US$93 billion for the year, up from the prior estimate of US$85 billion.
- Tesla’s Q3 adjusted net income fell 29% year-over-year to US$1.8 billion, coming in below expectations. Operating expenses surged 50% to US$3.4 billion, with tariff costs exceeding US$400 million. The company delivered a record 497,099 vehicles globally during the quarter as buyers rushed to take advantage of a US$7,500 U.S. electric vehicle tax credit that expired on September 30. Tesla expects its robotaxi business, launched in Austin, Texas in June, to expand to as many as 10 metropolitan areas by year-end, subject to regulatory approvals.
Name of Company | Revenue Growth (yoy) | Profit Growth (yoy) | Q3 Revenue | Q3 EPS |
|---|---|---|---|---|
| Nvidia | 62% | 59% | 4% | 4% |
| Microsoft | 18% | 25% | 3% | 12% |
| Apple | 8% | 10% | 0.2% | 3% |
| Amazon | 13% | 38% | 1% | 24% |
| Broadcom | 28% | 39% | 3% | 4% |
| Alphabet | 16% | 22% | 2% | 24% |
| Meta | 26% | 5% | 4% | -6% |
| Tesla | 12% | -29% | 3% | -12% |
Source: Nasdaq Global Indexes, FactSet, company filings.
Note: Figures are on non-GAAP basis. Excluding the one-time tax charge, Meta’s Q3 net income would have risen to US$18.64 billion.
- On average, Nasdaq-100 firms beat their revenue and earnings estimates for the quarter by 2.2% and 5.4%, respectively, with 73 companies (83% by weight) exceeding both top-line and bottom-line expectations.
- The rate of top-line beats by index weight surpasses that of the previous quarter, while declining on the bottom line. By constituent count, revenue beat rates are in line with prior-quarter levels, whereas earnings beat rates remain lower.
| Beats | Misses | ||
|---|---|---|---|---|
| No. of firms / | Average | No. of firms / Index weight | Average |
| Q3 2025 Revenues | 88 / 96.2% | 2.7% | 12 / 3.8% | -1.1% |
| Q3 2025 Earnings | 82 / 85.7% | 8.6% | 18 / 14.3% | -8.7% |
Source: Nasdaq Global Indexes, FactSet. Data as of December 15, 2025.
Disclaimer:
Nasdaq®, Nasdaq-100® and Nasdaq-100 Index® are registered trademarks of Nasdaq, Inc. The information contained above is provided for informational and educational purposes only, and nothing contained herein should be construed as investment advice, either on behalf of a particular security or an overall investment strategy. Neither Nasdaq, Inc. nor any of its affiliates makes any recommendation to buy or sell any security or any representation about the financial condition of any company. Statements regarding Nasdaq-listed companies or Nasdaq proprietary indexes are not guarantees of future performance. Actual results may differ materially from those expressed or implied. Past performance is not indicative of future results. Investors should undertake their own due diligence and carefully evaluate companies before investing. ADVICE FROM A SECURITIES PROFESSIONAL IS STRONGLY ADVISED.
© 2025. Nasdaq, Inc. All Rights Reserved.


Latest articles

This data feed is not available at this time.
Data is currently not available