
May 2023 Review and Outlook
Executive summary:
- Inflation is moderating
- AI takes the market by storm
- Equity markets rally, though breadth is narrow
- YTD, the Nasdaq-100 is up over 31%; while the Dow and Russell 2000 are flat
- The U.S. economy expanded 1.3% in the first quarter
- Corporate profits declined for the 2nd straight quarter but were better than expected
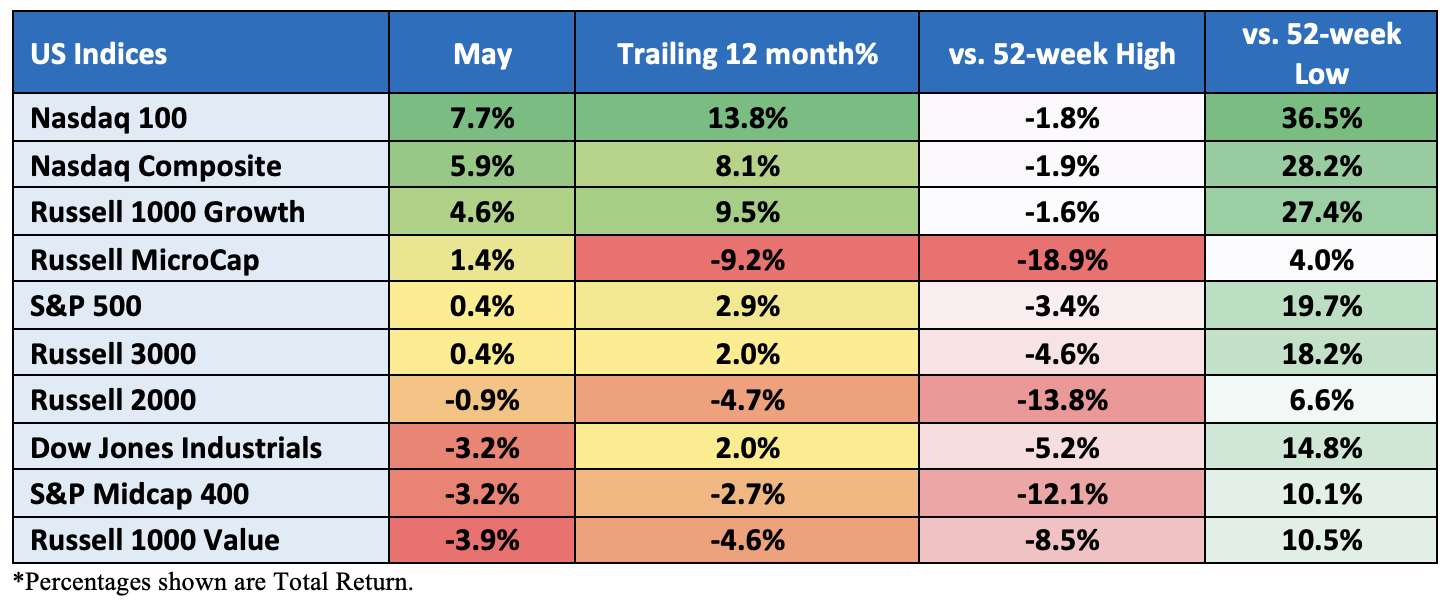
Index performance for May:
Sector performance total return for May:

In recent months, “AI,” or Artificial Intelligence, has become the latest buzzword in the business world. Artificial Intelligence and its growth potential dominated headlines across all the financial channels throughout the month of May.
Growth outperformed Value in May. The Russell 1000 Growth Index gained 4.6% for the month, while the Russell 1000 Value Index lost nearly 4%. The Nasdaq 100 Index, which is heavily weighted in the tech space (and thus a potential winner in the AI discussion), gained 7.7% in May, rose over 30% YTD and made a new 52-week high this month.
In contrast, the Dow is flat for the year. Some might caution about market breadth here with narrow leadership, with multiple bearish talking points as a possible head fake. Seven of the top eight stocks in the S&P 500 by market cap are primarily responsible for all the 2023 gains.
As expected, the Federal Reserve, with a unanimous vote, hiked rates by 25bps at the May meeting, bringing the overnight rate to 5.00%-5.25%. During the ensuing press conference, Fed Chair Powell said the FOMC might be inclined to pause future rate hikes but is not thinking of cutting rates soon. This stood in contrast to traders’ view, in the fed funds futures market, that there will be three rate cuts before the end of the year. Chair Powell did say that if the Fed’s inflation forecast is broadly right, it would not be appropriate to cut rates as it is not possible to say with confidence if 5.00-5.25% is “sufficiently restrictive.” Additionally, the tightening of credit conditions (following the banking crisis) complicates the task of achieving a restrictive stance.
Still, Mr. Powell said that there is a sense we are much closer to the end of the tightening cycle than the beginning, though he did stress the committee will continue to be “data dependent.”
The May FOMC meeting minutes showed officials were split on a decision for further hikes. Fed fund futures are now pricing in only a 2% chance of a 25bps hike at the June meeting.
Inflation continues to moderate, which is good for interest rates and, thus, the stock market. April’s CPI printed at 4.9%, down from the June peak of 9%. While still elevated and far from the Fed’s 2% target rate, it is tracking in the right direction.
The debt-limit deal brokered by President Biden and House Speaker Kevin McCarthy is expected to be passed in Congress to avoid the worst-case US default and federal government running out of cash in early June.
Despite volatility in the banking sector that led to a sharp selloff at the start of the month, regional banks have rallied somewhat as the fear of contagion dissipated into month’s end. The KBW Regional Bank Index closed the month down 9%.
KBW Regional Bank Index for May:

US One-Year CDS:

Rate Hike Odds for June suggest a three in four chance of no change:

And cuts later in the year:

Nasdaq-100, one year:

Treasuries:
Treasuries finished May with gains across the curve. The yield on the benchmark U.S.10-year Treasury now sits at 3.64% compared to 3.43% at April end. The 30-year yield now sits at 3.86% (3.68%). Shorter term 2s rallied into month-end and now yield. 4.40%. However, certain aspects of the yield curve remain inverted, such as two-year treasuries yielding more than 10-year maturities (chart below).
10-Year Treasury Constant Maturity Minus 2-Year Treasury Constant Maturity

Earnings commentary:
According to FactSet, S&P 500 companies reported the 2nd straight quarter of Y/Y declines. However, index members did record their best earnings performance relative to analyst expectations since Q4’21. With nearly all the S&P 500 constituents reported, 78% posted a positive EPS surprise, while 76% had a positive revenue surprise. The quarterly blended earnings decline for the index was -2.1% vs. the 6.5% decline expected at the beginning of the quarter. Interestingly, FactSet pointed out that the number of companies discussing “recession” on their calls declined for a 3rd straight quarter.
Economic commentary:
The U.S. Department of Labor’s May 5th Employment Situation Report for April posted better-than-expected numbers on job creation (+253,000 new vs. +185,000 consensus), a lower unemployment rate (+3.4% vs. 3.6% consensus) and strong hourly wage growth (+0.5% vs. 0.3%), reinforcing the idea of a robust labor market and one of the reasons why the Fed isn’t inclined to cut rates soon. The labor force participation rate remained steady at 62.6%.
April’s headline CPI was in-line with expectations at +0.4% M/M and up 4.9% Y/Y compared to 5.0% in March. Core-CPI, which excludes food and energy, was also up 0.4% M/M (in-line with consensus) and up 5.5% Y/Y vs. +5.6% in March. Shelter (+0.4%) was the largest contributor to the increase in total CPI and core CPI. The 0.4% increase was the smallest uptick for the shelter index since January 2022. As far as the market is concerned, the continued moderation in inflation (including the shelter index) should help temper the Fed to keep its policy rate unchanged when it meets again in June.
PPI continued to moderate last month. April PPI increased 0.2% (consensus +0.3%) though the prior month was revised to -0.4% from -0.5%. April Core PPI increased 0.2% (in-line with consensus). Total PPI Y/Y increased 2.3% vs. +2.7% in March. Ex-food and energy, PPI was up 3.2% versus +3.4% in March.
Retail sales (which do not adjust for inflation) rose in April due primarily to price increases and not as much to increased demand. Total retail sales increased by 0.4% M/M (consensus +0.8%) following an upwardly revised March (-0.7% from -1% previously reported). Ex-autos, retail sales increased 0.4%, also following an upwardly revised March number (-0.5% from -0.8%).
U.S. Initial Jobless Claims remain low and are relatively consistent with a tight labor market. For the week ending May 20th, new claims were 229,000 (consensus 245,000), in-line with the four-week average. Continuing jobless claims decreased slightly to 1.794 million from 1.799 million.
The U.S. Department of Commerce released an upwardly revised estimate for Q1’22 GDP. The second estimate numbers showed the economy grew by 1.3% annually (consensus at +1.1%) on the back of strong consumer spending despite elevated inflation numbers. The GDP Chain Deflator (price index) was revised up to 4.2% from 4.0%.
Personal income increased 0.4% in April (in-line with consensus) while personal spending increased 0.8% (consensus of +0.5%), above March’s upwardly revised +0.1% level.
The PCE Price Index was up 4.4% Y/Y, vs. +4.2% in March, and the core PCE Price Index, which excludes food and energy, rose 4.7% vs. +4.6% in March. On a monthly basis, the PCE deflator rose 0.4% while core increased 0.4%, both above consensus.
The Conference Board’s Consumer Confidence Index fell in May to 102.3 (consensus was 99) from an upwardly revised 103.7 in April. The Expectations Index (based on consumers’ short-term outlook for income, business and labor market conditions) decreased to 71.5 from 71.7. According to The Conference Board, the Expectations Index has remained below 80, the level associated with a recession within the next year, every month since February 2022, except for a brief uptick in December 2022.
CPI Inflation – YoY:

Oil:
Oil futures fell to multi-week lows on concerns over weakening demand and a stronger dollar. The front-month contract for crude fell 11% in May. Weaker-than-expected Chinese manufacturing activity for May spooked investors at month’s end who were hopeful that China’s PMI would rebound after the nation ended its COVID-19 policies.
Also, a reminder that OPEC+ will meet on June 4th to discuss the prospect of production cuts that could spark volatility in the space.
Crude Oil front-month contract for May:

Dollar:
The dollar rose over 2.5% in May, closing at monthly highs following two months of declines. Stronger-than-expected jobs data and somewhat stick inflation lent support to the dollar as traders are now talking about the possibility of another rate hike at the Federal Reserve’s next meeting in June.

Looking ahead:
There will be many market catalysts in June. On the , the May Jobs report is released Friday morning (6/2). Economists are expecting the unemployment rate to rise to 3.5%. CPI will be released on June 13, followed by PPI on June 14th. The FOMC rate decision will also be on June 14. On June 16th, we have “triple witch” options expiration and the concurrent S&P Index rebalancing. Finally, on June 23, at the close, we have the annual Russell Reconstitution, which is traditionally one of the highest equity volume days of the year. The larger question for the market is whether the rally in tech stocks will spread to other sectors or if the “long and variable lags” in Fed policy and tighter credit conditions will impact corporate earnings in 2H.
The information contained herein is provided for informational and educational purposes only, and nothing contained herein should be construed as , either on behalf of a particular security or an overall investment strategy. All information contained herein is obtained by Nasdaq from sources believed by Nasdaq to be accurate and reliable. However, all information is provided “as is” without warranty of any kind. ADVICE FROM A SECURITIES PROFESSIONAL IS STRONGLY ADVISED.
The views and opinions expressed herein are the views and opinions of the author and do not necessarily reflect those of Nasdaq, Inc.
Other Topics
Earnings Central Banks Oil Artificial Intelligence
The Market Intelligence Desk Team
Nasdaq
Nasdaq’s Market Intelligence Desk (MID) is designed to provide critical touch-points for timely trading analysis and market information.