
June, Mid-Year 2023 Review and Outlook
Executive Summary
- The Nasdaq 100 posts record 1H gain
- Narrow market breadth improved in June with rotation into cyclicals
- Industrials and Homebuilding industries “break out” to new all-time highs
- Rates volatility declining to normalized levels
- Markets pricing between one and two additional quarter-point rate hikes
- Corporate earnings are expected to decline for the third consecutive quarter
- Sentiment rebounding amidst softening inflation and resilient employment and housing data
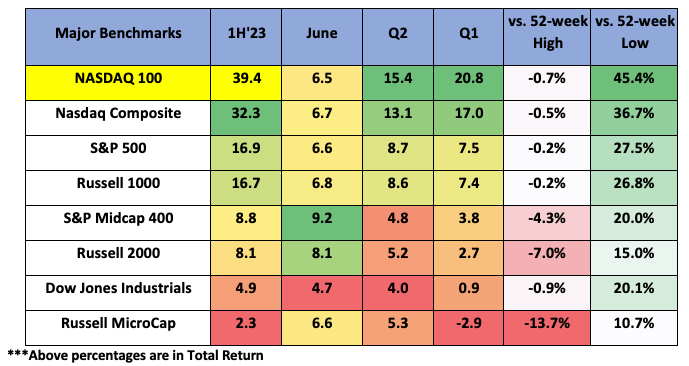
The broad U.S. equity benchmarks finished higher in the 1H of 2023 amidst a range of robust and lethargic equity index returns based largely on the size and sector weighting of its members. Large-cap and growth stocks grossly outperformed small caps and value, with the mixed performances attributed to a plethora of concerns permeating the marketplace.
The Nasdaq-100 (NDX) gained a historic 39.4% in the 1H of 2023, its best 1H performance since inception (1985). The NDX also had its best relative 1H performance versus the S&P 500 (+16.9%), Russell 2000 (+8.1%) and the Dow Jones Industrials (+4.9%). The record outperformance by the NDX over its benchmark peers had many bears voicing concerns over narrow leadership and poor market breadth as both the Dow Jones Industrials and Russell 2000 were essentially flat on the year through the end of May. However, market breadth improved meaningfully in June, when the Dow Jones Industrials (INDU), S&P 500 (SPX), and the S&P 500 equal-weight (SPW) indices all notched their best monthly performance for 2023.
History shows strong Nasdaq outperformance in the 1H of the year often translates into strong performance for most equities in the 2H. In the top 10 record 1H outperformances by the NDX versus the S&P 500, the 2H of the year saw the following performance metrics:
Nasdaq-100:
- Higher 8/10 years for an average return of 21.8%
- S&P 500: higher 9/10 years for an average return of 11.4%
- Dow Jones Industrials: higher 9/10 years for an average return of 11.2%
- Russell 2000: higher 7/10 years for an average return of 10.2%
From a technical perspective, June was a noteworthy month for the broad-based S&P 500 index. In June’s first trading session, the SPX “broke out” above the widely watched ~4,200 level (below chart, purple shade), whose technical importance grew over the increasing number of times it acted as support and resistance since February 2022.
Breakouts from big ranges can often be accompanied by strong momentum. Its Advance-Decline Line (below chart, lower panel), a common breadth measure aggregating the number of advancing and declining stocks, reached new highs in both mid and late June. The ADL gives equal weight to all members of an index, and its move to new highs confirms broad participation and validates the strength in the NDX.

Sector Performance

Seven of 11 sectors finished higher in the 1H, led by Technology (+42.8%), Communications (36.3%), and Discretionary (+33%). The cap-weighted S&P 500 Technology Index (below chart; upper panel) came within a few ticks of its prior all-time high previously set in December 2021. It has since spent the last two weeks trading sideways in what appears to be constructive consolidation below expected near-term resistance following a prior steep uptrend. While its strong outperformance was led by robust gains from a smaller number of mega-cap companies, it is worth highlighting that the equal-weight Technology Index and the small-cap Russell 2000 Technology Index gained a more than respectable 21.4% and 22.6%, respectively, in the 1H. In mid-June, the large-cap S&P 500 Equal Weight Technology Index (middle panel) broke out above an 11-month resistance level to new 52-week highs, while the Russell 2000 Technology Index (lower panel) is pushing up against its 11-month resistance.

While Technology and growth were the primary drivers of the strong performance over the first five months of 2023, there was a clear rotation into cyclicals during the month of June, which may reflect improving economic activity. All eleven sectors finished the month in the green. Discretionary (+12.1%), led by Tesla and Amazon, was the top-performing sector, followed by Industrials (11.3%) and Materials (11.1%).
The noteworthy standout at the sector level is Industrials, whose strong June performance and upside follow-through in early July has led it to new all-time highs previously set In November 2021. The strong June performance was supported by widespread participation, with 37% of its members trading at 52-week highs (lower panel), the highest reading in more than two years.

At the start of the year, there was no shortage of market experts forecasting an economic recession due to the lagging effects of the Federal Reserve’s now ongoing 15-month rate hike cycle. Stoking the flames of a potential credit crunch was the March bank turmoil when four U.S. banks and one European bank folded. The ensuing rates volatility reached extreme levels never seen outside of the GFC era; however, the MOVE Index has been trending lower to more normalized levels due in part to new liquidity facilities provided by regulators. Reduced bond volatility is a positive for overall market liquidity.

Economic data has been coming in stronger than expected, as reflected by the Bloomberg Economic Surprise Index, which measures the percentage difference between actual economic data and the median analysts’ forecast. The index has been trending sharply higher since early April and now stands at its highest level in more than two years.

Last week, Q1 GDP was revised notably higher to 2% from 1.3%, reflecting upward revisions to exports and consumer spending. Consumer confidence increased to its highest level since the start of 2022, which could be attributed to the resilient labor market and softening inflation. The unemployment rate (May) remains near generational lows, and the latest reading showed increasing residential construction payrolls. Inflation is softening, as evidenced by core CPI and PPI; however, the Fed’s preferred measure, core PCE, has remained elevated.

Housing has seen a noticeable rebound despite the sharp rise in mortgage rates. Existing home sales remain well below the prior cycle’s highs as many homeowners are reluctant to move out of their low mortgage rate homes. However, new home sales, building permits, housing starts, and homebuilder sentiment (NAHB) have been trending noticeably higher due in part to favorable millennium demographics and the post-covid migration trend away from bigger metropolitan cities.

In June, the Dow Jones Homebuilders Index broke out to fresh all-time highs.

The debt ceiling resolution raised concerns the ensuing increase in debt issuance would drain liquidity from the marketplace and, with it, lead to increased volatility and falling asset prices. However, the Fed’s quantitative tightening is retiring longer-duration bonds while the majority of new issuance has been shorter-duration T-bills which have largely been absorbed by “cash on the sidelines” money market funds. Reduced duration in the system via increased T-bill issuance could be forcing investors to take more risk.
Q2 corporate earnings are expected to decline for the 3rd consecutive quarter. The estimated earnings decline for the S&P 500 is 6.8% which would mark the largest decline since Q2 2020, according to FactSet. The S&P 500’s forward 12M P/E ratio is 18.9 vs. the 5yr and 10yr averages of 18.6 and 17.4, respectively.
The Federal Reserve paused rate hikes at the June meeting; however, policymakers then forecasted two additional rate hikes this year. Markets are locking in a rate hike at the upcoming July meeting with 40% odds for an additional quarter-point hike to follow. The threat of additional rate hikes previously led to a decline in asset prices throughout 2022. More recently, Chair Powell has given increasing hawkish rhetoric in public appearances, yet there has been a change in character as asset prices have been steadfast.
Markets are seemingly pricing in a more optimistic economic outlook than what many media and market pundits have been reporting and forecasting. Record index performance, improving market breadth, new highs in industrials and homebuilders, resilient economic data, softening inflation, improving 2H corporate earnings, and an AI revolution may combined suggest that one of the most widely anticipated recessions may not be in the cards this year after all.
The information contained herein is provided for informational and educational purposes only, and nothing contained herein should be construed as , either on behalf of a particular security or an overall investment strategy. All information contained herein is obtained by Nasdaq from sources believed by Nasdaq to be accurate and reliable. However, all information is provided “as is” without warranty of any kind. ADVICE FROM A SECURITIES PROFESSIONAL IS STRONGLY ADVISED.
The views and opinions expressed herein are the views and opinions of the author and do not necessarily reflect those of Nasdaq, Inc.

The Market Intelligence Desk Team
Nasdaq
Nasdaq’s Market Intelligence Desk (MID) is designed to provide critical touch-points for timely trading analysis and market information.