
Freeport-McMoRan (NYSE:FCX) is set to report its earnings on Thursday, April 24, 2025.
The company has $47 Bil in current market capitalization. Revenue over the last twelve months was $25 Bil, and it was operationally profitable with $6.9 Bil in operating profits and net income of $1.9 Bil. That said, if you seek upside with lower volatility than individual stocks, the Trefis High-Quality portfolio presents an alternative – having outperformed the S&P 500 and generated returns exceeding 91% since its inception.
See earnings reaction history of all stocks
Freeport-McMoRan’s Historical Odds Of Positive Post-Earnings Return
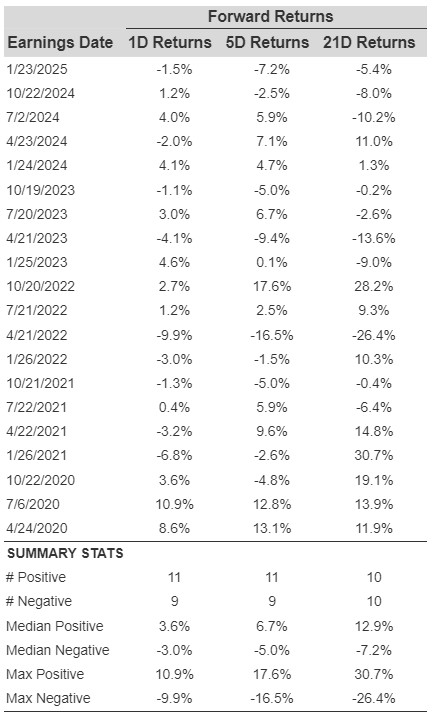
Some observations on one-day (1D) post-earnings returns:
- There are 20 earnings data points recorded over the last five years, with 11 positive and 9 negative one-day (1D) returns observed. In summary, positive 1D returns were seen about 55% of the time.
- Notably, this percentage increases to 64% if we consider data for the last 3 years instead of 5.
- Median of the 11 positive returns = 3.6%, and median of the 9 negative returns = -3.0%
Additional data for observed 5-Day (5D), and 21-Day (21D) returns post earnings are summarized along with the statistics in the table below.
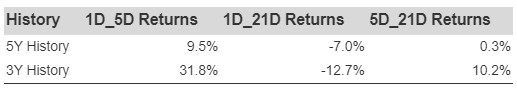
Correlation Between 1D, 5D, and 21D Historical Returns A relatively less risky strategy (though not useful if the correlation is low) is to understand the correlation between short-term and medium-term returns post earnings, find a pair that has the highest correlation, and execute the appropriate trade. For example, if 1D and 5D show the highest correlation, a trader can position themselves “long” for the next 5 days if 1D post-earnings return is positive. Here is some correlation data based on 5-year and 3-year (more recent) history. Note that the correlation 1D_5D refers to the correlation between 1D post-earnings returns and subsequent 5D returns.
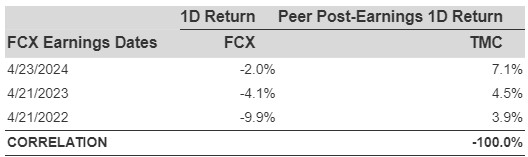
Is There Any Correlation With Peer Earnings?
Sometimes, peer performance can have influence on post-earnings stock reaction. In fact, the pricing-in might begin before the earnings are announced. Here is some historical data on the past post-earnings performance of Freeport-McMoRan stock compared with the stock performance of peers that reported earnings just before Freeport-McMoRan. For fair comparison, peer stock returns also represent post-earnings one-day (1D) returns.
Learn more about Trefis RV strategy that has outperformed its all-cap stocks benchmark (combination of all 3, the S&P 500, S&P mid-cap, and Russell 2000), to produce strong returns for investors. Separately, if you want upside with a smoother ride than an individual stock like Freeport-McMoRan, consider the High Quality portfolio, which has outperformed the S&P, and clocked >91% returns since inception.
Invest with Trefis Market Beating Portfolios
See all Trefis Price Estimates
The views and opinions expressed herein are the views and opinions of the author and do not necessarily reflect those of Nasdaq, Inc.

