Once you finally get to stop working, it shouldn’t be a full-time job figuring out how to finagle your finances to stretch your Roth IRA, 401(k), pension, Social Security and other retirement savings throughout your golden years. Whatever you have set aside for your retirement years will be greatly impacted by how you’ve invested your money and the location where you choose to retire.
When it comes to this specific retirement calculus, the aim is to live better and not worry about whether you’ll live longer. Depending on when you retire, and at what age, your Social Security income will vary, so it’s good to have a separate nest egg. Having at least $650,000 saved in other retirement accounts may seem like a big sum of money, but how long will it last you?
Find Out: How Long $1 Million in Retirement Will Last in Every State
Read Next: How Much a Comfortable Retirement Will Cost You in Each State
GOBankingRates recently did a study to determine how long $650,000 plus your Social Security benefits would last you in retirement in every state based on factors such as median household income, average home value, mortgage payments and cost of living. States were then ranked by the longest amount of time to draw down $650,000 in savings to the shortest.
When you’re done, you can also check out how much retirement savings you need to retire in each state.

West Virginia
- Total population: 1,775,156
- Percentage of population aged 65 and older: 21.2%
- Average monthly cost of living: $2,814
- Total monthly cost of living after Social Security: $946
- Average annual cost of living: $33,767
- Total annual cost of living after Social Security: $11,353
- Years to draw down $650,000 in retirement savings: 57.25
Be Aware: 3 Signs You’ve ‘Made It’ Financially, According to Financial Influencer Genesis Hinckley
Learn More: Cutting Expenses for Retirement? Here’s the No. 1 Thing To Get Rid of First

Mississippi
- Total population: 2,940,057
- Percentage of population aged 65 and older: 17.5%
- Average monthly cost of living: $2,847
- Total monthly cost of living after Social Security: $979
- Average annual cost of living: $34,161
- Total annual cost of living after Social Security: $11,748
- Years to draw down $650,000 in retirement savings: 55.33
Try This: I’m a Retired Boomer: Here Are 3 Debts You Should Definitely Pay Off Before Retirement
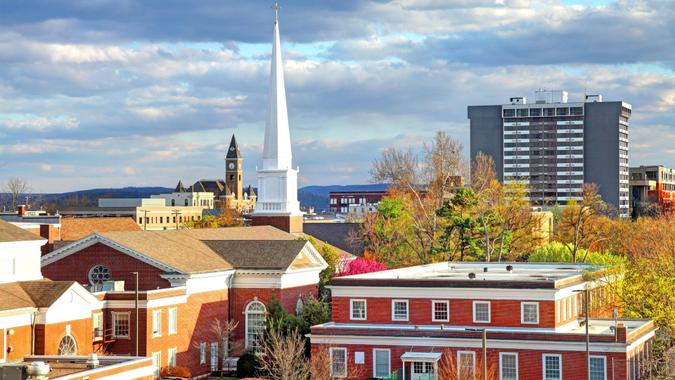
Arkansas
- Total population: 3,045,637
- Percentage of population aged 65 and older: 17.7%
- Average monthly cost of living: $2,925
- Total monthly cost of living after Social Security: $1,058
- Average annual cost of living: $35,105
- Total annual cost of living after Social Security: $12,691
- Years to draw down $650,000 in retirement savings: 51.22

Louisiana
- Total population: 4,590,241
- Percentage of population aged 65 and older: 17.0%
- Average monthly cost of living: $2,930
- Total monthly cost of living after Social Security: $1,062
- Average annual cost of living: $35,156
- Total annual cost of living after Social Security: $12,742
- Years to draw down $650,000 in retirement savings: 51.01

Oklahoma
- Total population: 4,019,800
- Percentage of population aged 65 and older: 16.5%
- Average monthly cost of living: $2,997
- Total monthly cost of living after Social Security: $1,129
- Average annual cost of living: $35,966
- Total annual cost of living after Social Security: $13,552
- Years to draw down $650,000 in retirement savings: 47.96

Alabama
- Total population: 5,074,296
- Percentage of population aged 65 and older: 18.0%
- Average monthly cost of living: $3,084
- Total monthly cost of living after Social Security: $1,217
- Average annual cost of living: $37,012
- Total annual cost of living after Social Security: $14,598
- Years to draw down $650,000 in retirement savings: 44.53
Trending Now: 3 Reasons You Should Not Buy a House When You Retire

Kentucky
- Total population: 4,512,310
- Percentage of population aged 65 and older: 17.5%
- Average monthly cost of living: $3,091
- Total monthly cost of living after Social Security: $1,223
- Average annual cost of living: $37,088
- Total annual cost of living after Social Security: $14,674
- Years to draw down $650,000 in retirement savings: 44.30

Iowa
- Total population: 3,200,517
- Percentage of population aged 65 and older: 18.4%
- Average monthly cost of living: $3,131
- Total monthly cost of living after Social Security: $1,263
- Average annual cost of living: $37,573
- Total annual cost of living after Social Security: $15,159
- Years to draw down $650,000 in retirement savings: 42.88
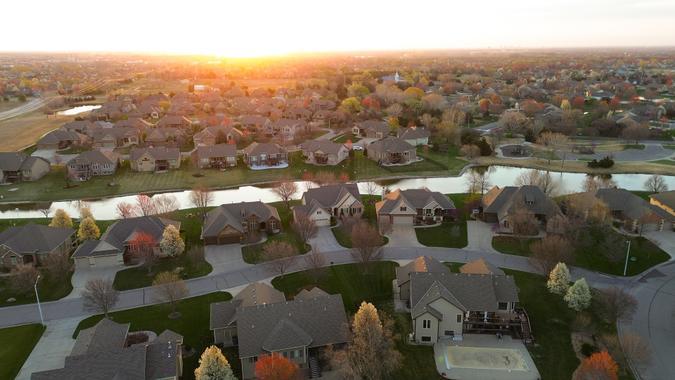
Kansas
- Total population: 2,937,150
- Percentage of population aged 65 and older: 17.2%
- Average monthly cost of living: $3,142
- Total monthly cost of living after Social Security: $1,274
- Average annual cost of living: $37,699
- Total annual cost of living after Social Security: $15,285
- Years to draw down $650,000 in retirement savings: 42.52

Missouri
- Total population: 6,177,957
- Percentage of population aged 65 and older: 18.0%
- Average monthly cost of living: $3,205
- Total monthly cost of living after Social Security: $1,337
- Average annual cost of living: $38,455
- Total annual cost of living after Social Security: $16,041
- Years to draw down $650,000 in retirement savings: 40.52
Check Out: I’m an Economist: Here’s My Prediction for Social Security If Trump Wins the 2024 Election
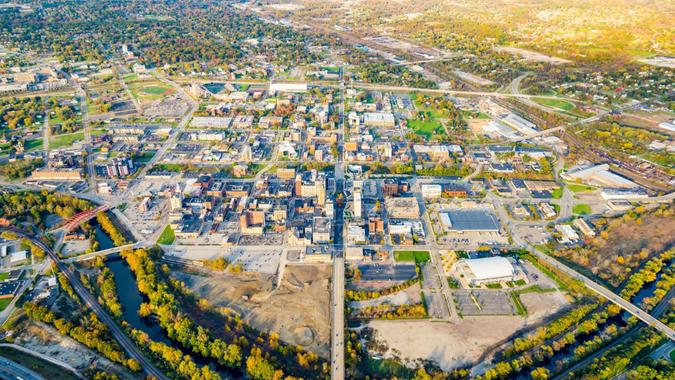
Ohio
- Total population: 11,756,058
- Percentage of population aged 65 and older: 18.4%
- Average monthly cost of living: $3,212
- Total monthly cost of living after Social Security: $1,344
- Average annual cost of living: $38,541
- Total annual cost of living after Social Security: $16,127
- Years to draw down $650,000 in retirement savings: 40.31

Indiana
- Total population: 6,833,037
- Percentage of population aged 65 and older: 16.9%
- Average monthly cost of living: $3,230
- Total monthly cost of living after Social Security: $1,362
- Average annual cost of living: $38,758
- Total annual cost of living after Social Security: $16,344
- Years to draw down $650,000 in retirement savings: 39.77
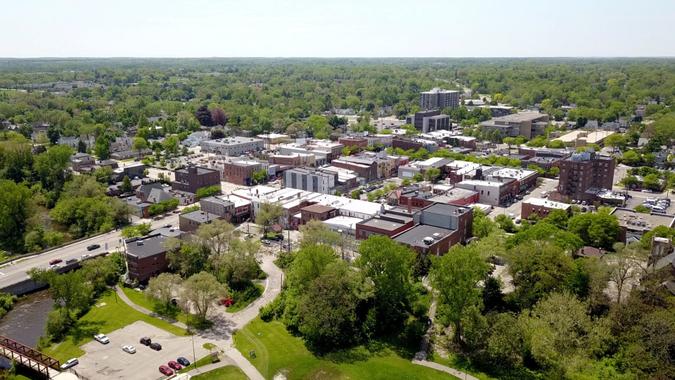
Michigan
- Total population: 10,034,118
- Percentage of population aged 65 and older: 18.7%
- Average monthly cost of living: $3,259
- Total monthly cost of living after Social Security: $1,392
- Average annual cost of living: $39,113
- Total annual cost of living after Social Security: $16,699
- Years to draw down $650,000 in retirement savings: 38.92

Nebraska
- Total population: 1,967,923
- Percentage of population aged 65 and older: 17.0%
- Average monthly cost of living: $3,388
- Total monthly cost of living after Social Security: $1,521
- Average annual cost of living: $40,662
- Total annual cost of living after Social Security: $18,248
- Years to draw down $650,000 in retirement savings: 35.62
For You: 5 Reasons Retirees Regret Selling Their Homes in Retirement

North Dakota
- Total population: 779,261
- Percentage of population aged 65 and older: 16.7%
- Average monthly cost of living: $3,425
- Total monthly cost of living after Social Security: $1,557
- Average annual cost of living: $41,094
- Total annual cost of living after Social Security: $18,680
- Years to draw down $650,000 in retirement savings: 34.80

Pennsylvania
- Total population: 12,972,008
- Percentage of population aged 65 and older: 19.6%
- Average monthly cost of living: $3,433
- Total monthly cost of living after Social Security: $1,565
- Average annual cost of living: $41,194
- Total annual cost of living after Social Security: $18,780
- Years to draw down $650,000 in retirement savings: 34.61
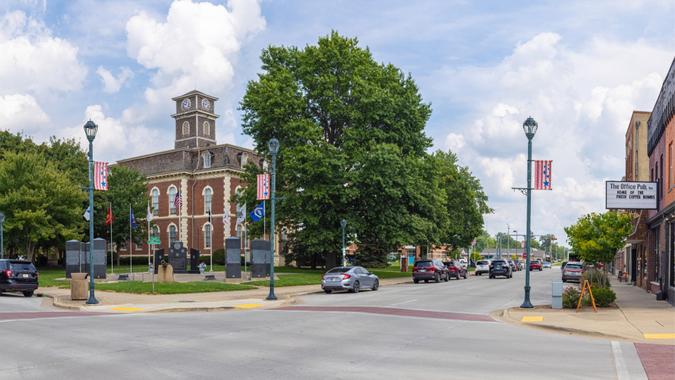
Illinois
- Total population: 12,582,032
- Percentage of population aged 65 and older: 17.2%
- Average monthly cost of living: $3,457
- Total monthly cost of living after Social Security: $1,589
- Average annual cost of living: $41,485
- Total annual cost of living after Social Security: $19,072
- Years to draw down $650,000 in retirement savings: 34.08

New Mexico
- Total population: 2,113,344
- Percentage of population aged 65 and older: 19.2%
- Average monthly cost of living: $3,580
- Total monthly cost of living after Social Security: $1,712
- Average annual cost of living: $42,963
- Total annual cost of living after Social Security: $20,549
- Years to draw down $650,000 in retirement savings: 31.63
Explore More: I’m an Economist: Here’s My Prediction for Social Security If Kamala Harris Wins the Election

Tennessee
- Total population: 7,051,339
- Percentage of population aged 65 and older: 17.3%
- Average monthly cost of living: $3,612
- Total monthly cost of living after Social Security: $1,744
- Average annual cost of living: $43,343
- Total annual cost of living after Social Security: $20,929
- Years to draw down $650,000 in retirement savings: 31.06
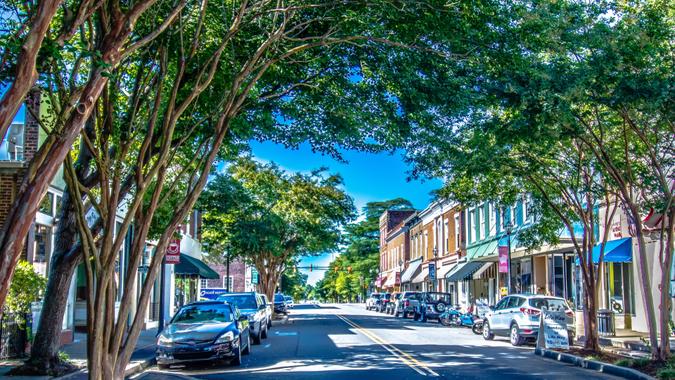
South Carolina
- Total population: 5,282,634
- Percentage of population aged 65 and older: 19.1%
- Average monthly cost of living: $3,618
- Total monthly cost of living after Social Security: $1,750
- Average annual cost of living: $43,417
- Total annual cost of living after Social Security: $21,003
- Years to draw down $650,000 in retirement savings: 30.95

Texas
- Total population: 30,029,572
- Percentage of population aged 65 and older: 13.4%
- Average monthly cost of living: $3,625
- Total monthly cost of living after Social Security: $1,758
- Average annual cost of living: $43,505
- Total annual cost of living after Social Security: $21,091
- Years to draw down $650,000 in retirement savings: 30.82
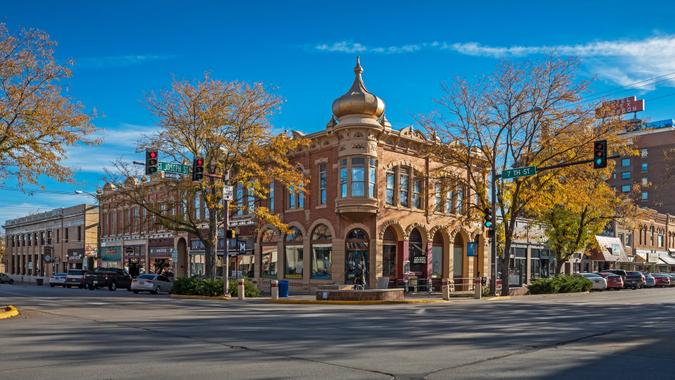
South Dakota
- Total population: 909,824
- Percentage of population aged 65 and older: 18.2%
- Average monthly cost of living: $3,641
- Total monthly cost of living after Social Security: $1,773
- Average annual cost of living: $43,696
- Total annual cost of living after Social Security: $21,282
- Years to draw down $650,000 in retirement savings: 30.54
Read More: What a Middle-Class Social Security Check Could Look Like in 2025

Wisconsin
- Total population: 5,892,539
- Percentage of population aged 65 and older: 18.7%
- Average monthly cost of living: $3,738
- Total monthly cost of living after Social Security: $1,870
- Average annual cost of living: $44,850
- Total annual cost of living after Social Security: $22,436
- Years to draw down $650,000 in retirement savings: 28.97

Georgia
- Total population: 10,912,876
- Percentage of population aged 65 and older: 15.1%
- Average monthly cost of living: $3,799
- Total monthly cost of living after Social Security: $1,931
- Average annual cost of living: $45,584
- Total annual cost of living after Social Security: $23,171
- Years to draw down $650,000 in retirement savings: 28.05

North Carolina
- Total population: 10,698,973
- Percentage of population aged 65 and older: 17.4%
- Average monthly cost of living: $3,855
- Total monthly cost of living after Social Security: $1,987
- Average annual cost of living: $46,260
- Total annual cost of living after Social Security: $23,846
- Years to draw down $650,000 in retirement savings: 27.26

Wyoming
- Total population: 581,381
- Percentage of population aged 65 and older: 18.6%
- Average monthly cost of living: $3,857
- Total monthly cost of living after Social Security: $1,990
- Average annual cost of living: $46,288
- Total annual cost of living after Social Security: $23,874
- Years to draw down $650,000 in retirement savings: 27.23
Discover More: Here Are All the Promises Trump Has Made About Social Security If He’s Reelected

Minnesota
- Total population: 5,717,184
- Percentage of population aged 65 and older: 17.4%
- Average monthly cost of living: $3,916
- Total monthly cost of living after Social Security: $2,049
- Average annual cost of living: $46,997
- Total annual cost of living after Social Security: $24,583
- Years to draw down $650,000 in retirement savings: 26.44

Delaware
- Total population: 1,018,396
- Percentage of population aged 65 and older: 20.8%
- Average monthly cost of living: $4,192
- Total monthly cost of living after Social Security: $2,324
- Average annual cost of living: $50,302
- Total annual cost of living after Social Security: $27,888
- Years to draw down $650,000 in retirement savings: 23.31

Virginia
- Total population: 8,683,619
- Percentage of population aged 65 and older: 16.8%
- Average monthly cost of living: $4,216
- Total monthly cost of living after Social Security: $2,348
- Average annual cost of living: $50,587
- Total annual cost of living after Social Security: $28,173
- Years to draw down $650,000 in retirement savings: 23.07

Florida
- Total population: 22,244,823
- Percentage of population aged 65 and older: 21.6%
- Average monthly cost of living: $4,364
- Total monthly cost of living after Social Security: $2,496
- Average annual cost of living: $52,370
- Total annual cost of living after Social Security: $29,956
- Years to draw down $650,000 in retirement savings: 21.70
Check Out: The Standard Retirement Age in the US vs. 5 European Countries
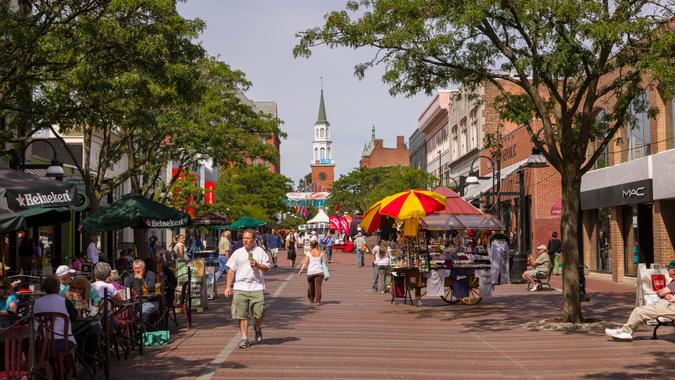
Vermont
- Total population: 647,064
- Percentage of population aged 65 and older: 21.6%
- Average monthly cost of living: $4,392
- Total monthly cost of living after Social Security: $2,524
- Average annual cost of living: $52,703
- Total annual cost of living after Social Security: $30,289
- Years to draw down $650,000 in retirement savings: 21.46

Maine
- Total population: 1,385,340
- Percentage of population aged 65 and older: 22.6%
- Average monthly cost of living: $4,441
- Total monthly cost of living after Social Security: $2,573
- Average annual cost of living: $53,293
- Total annual cost of living after Social Security: $30,879
- Years to draw down $650,000 in retirement savings: 21.05

Arizona
- Total population: 7,359,197
- Percentage of population aged 65 and older: 18.8%
- Average monthly cost of living: $4,469
- Total monthly cost of living after Social Security: $2,601
- Average annual cost of living: $53,626
- Total annual cost of living after Social Security: $31,212
- Years to draw down $650,000 in retirement savings: 20.83

Maryland
- Total population: 6,164,660
- Percentage of population aged 65 and older: 16.9%
- Average monthly cost of living: $4,501
- Total monthly cost of living after Social Security: $2,633
- Average annual cost of living: $54,011
- Total annual cost of living after Social Security: $31,597
- Years to draw down $650,000 in retirement savings: 20.57

Idaho
- Total population: 1,939,033
- Percentage of population aged 65 and older: 17.0%
- Average monthly cost of living: $4,544
- Total monthly cost of living after Social Security: $2,676
- Average annual cost of living: $54,528
- Total annual cost of living after Social Security: $32,114
- Years to draw down $650,000 in retirement savings: 20.24

Nevada
- Total population: 3,177,772
- Percentage of population aged 65 and older: 16.9%
- Average monthly cost of living: $4,614
- Total monthly cost of living after Social Security: $2,746
- Average annual cost of living: $55,365
- Total annual cost of living after Social Security: $32,951
- Years to draw down $650,000 in retirement savings: 19.73
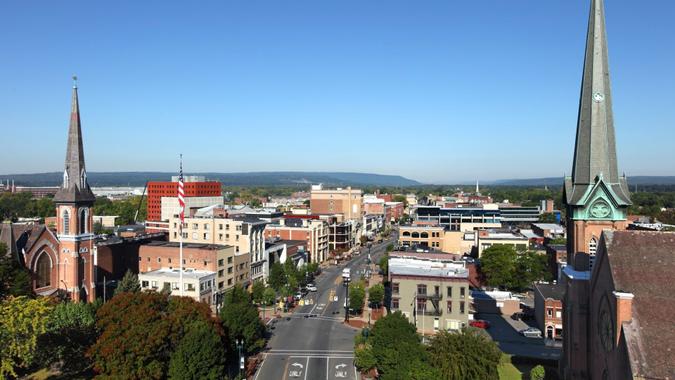
New York
- Total population: 19,677,151
- Percentage of population aged 65 and older: 18.1%
- Average monthly cost of living: $4,645
- Total monthly cost of living after Social Security: $2,777
- Average annual cost of living: $55,735
- Total annual cost of living after Social Security: $33,321
- Years to draw down $650,000 in retirement savings: 19.51

Connecticut
- Total population: 3,626,205
- Percentage of population aged 65 and older: 18.3%
- Average monthly cost of living: $4,655
- Total monthly cost of living after Social Security: $2,787
- Average annual cost of living: $55,856
- Total annual cost of living after Social Security: $33,442
- Years to draw down $650,000 in retirement savings: 19.44
Try This: Here’s the Income Needed To Be in the Top 1% in All 50 States

Montana
- Total population: 1,122,867
- Percentage of population aged 65 and older: 20.1%
- Average monthly cost of living: $4,670
- Total monthly cost of living after Social Security: $2,802
- Average annual cost of living: $56,041
- Total annual cost of living after Social Security: $33,627
- Years to draw down $650,000 in retirement savings: 19.33

Alaska
- Total population: 733,583
- Percentage of population aged 65 and older: 13.8%
- Average monthly cost of living: $4,788
- Total monthly cost of living after Social Security: $2,920
- Average annual cost of living: $57,456
- Total annual cost of living after Social Security: $35,042
- Years to draw down $650,000 in retirement savings: 18.55

Rhode Island
- Total population: 1,093,734
- Percentage of population aged 65 and older: 18.8%
- Average monthly cost of living: $4,891
- Total monthly cost of living after Social Security: $3,023
- Average annual cost of living: $58,694
- Total annual cost of living after Social Security: $36,280
- Years to draw down $650,000 in retirement savings: 17.92

Utah
- Total population: 3,380,800
- Percentage of population aged 65 and older: 11.9%
- Average monthly cost of living: $4,901
- Total monthly cost of living after Social Security: $3,033
- Average annual cost of living: $58,808
- Total annual cost of living after Social Security: $36,394
- Years to draw down $650,000 in retirement savings: 17.86
Be Aware: Kamala Harris’ Platform: How Her Plan for Social Security and Medicare Could Impact Your Finances

New Hampshire
- Total population: 1,395,231
- Percentage of population aged 65 and older: 20.2%
- Average monthly cost of living: $4,950
- Total monthly cost of living after Social Security: $3,082
- Average annual cost of living: $59,397
- Total annual cost of living after Social Security: $36,983
- Years to draw down $650,000 in retirement savings: 17.58

Oregon
- Total population: 4,240,137
- Percentage of population aged 65 and older: 19.3%
- Average monthly cost of living: $5,032
- Total monthly cost of living after Social Security: $3,165
- Average annual cost of living: $60,390
- Total annual cost of living after Social Security: $37,976
- Years to draw down $650,000 in retirement savings: 17.12

Colorado
- Total population: 5,839,926
- Percentage of population aged 65 and older: 15.7%
- Average monthly cost of living: $5,153
- Total monthly cost of living after Social Security: $3,285
- Average annual cost of living: $61,833
- Total annual cost of living after Social Security: $39,419
- Years to draw down $650,000 in retirement savings: 16.49
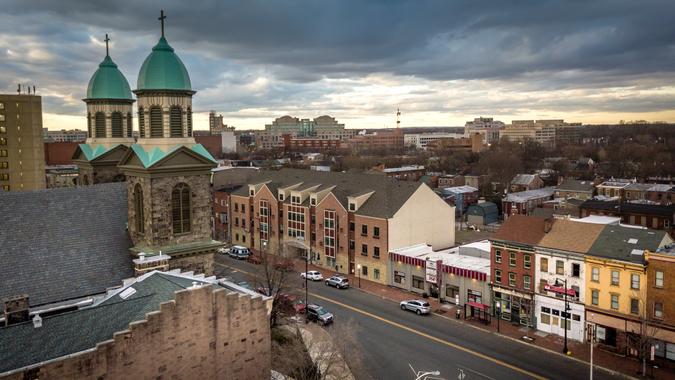
New Jersey
- Total population: 9,261,699
- Percentage of population aged 65 and older: 17.4%
- Average monthly cost of living: $5,196
- Total monthly cost of living after Social Security: $3,328
- Average annual cost of living: $62,351
- Total annual cost of living after Social Security: $39,937
- Years to draw down $650,000 in retirement savings: 16.28
Explore More: Here’s the Salary Needed to Actually Take Home $100K in Every State

Washington
- Total population: 7,785,786
- Percentage of population aged 65 and older: 16.8%
- Average monthly cost of living: $5,717
- Total monthly cost of living after Social Security: $3,849
- Average annual cost of living: $68,602
- Total annual cost of living after Social Security: $46,188
- Years to draw down $650,000 in retirement savings: 14.07
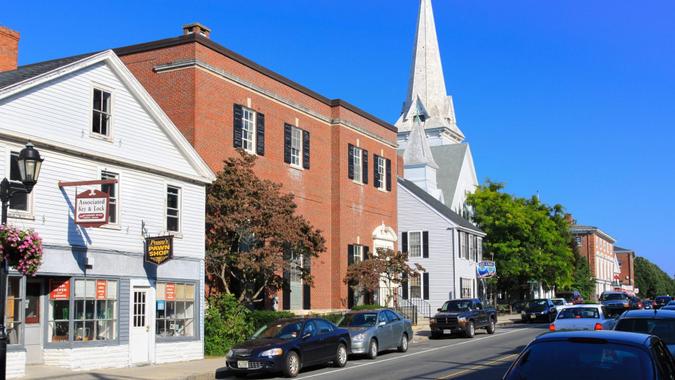
Massachusetts
- Total population: 6,981,974
- Percentage of population aged 65 and older: 18.0%
- Average monthly cost of living: $6,128
- Total monthly cost of living after Social Security: $4,261
- Average annual cost of living: $73,540
- Total annual cost of living after Social Security: $51,126
- Years to draw down $650,000 in retirement savings: 12.71
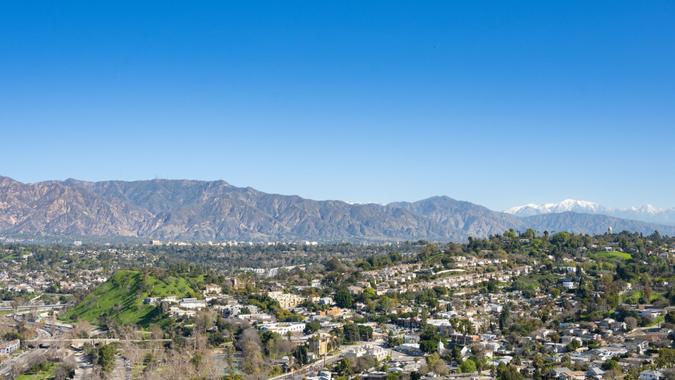
California
- Total population: 39,029,342
- Percentage of population aged 65 and older: 15.8%
- Average monthly cost of living: $7,009
- Total monthly cost of living after Social Security: $5,141
- Average annual cost of living: $84,110
- Total annual cost of living after Social Security: $61,696
- Years to draw down $650,000 in retirement savings: 10.54

Hawaii
- Total population: 1,440,196
- Percentage of population aged 65 and older: 20.5%
- Average monthly cost of living: $8,365
- Total monthly cost of living after Social Security: $6,497
- Average annual cost of living: $100,380
- Total annual cost of living after Social Security: $77,966
- Years to draw down $650,000 in retirement savings: 8.34
Methodology: For this study, GOBankingRates analyzed each U.S. state to find how far $650,000 and Social Security benefits will go in every state. First, GOBankingRates found information on each state, including total population, population ages 65 and over, median household income and total households, all sourced from the U.S. Census American Community Survey, the average single-family home value on June 2024 from Zillow Home Value Index and assuming a 10% down payment and using the national average 30-year fixed mortgage rate as sourced from the Federal Reserve Economic Data, the average mortgage cost can be calculated. The cost-of-living indexes were sourced from the Missouri Economic Research Information Center, and using the national average expenditure costs for residents aged 65 and over, as sourced from the Bureau of Labor Statistics Consumer Expenditure Survey, the average expenditure costs can be calculated. The expenditure costs and mortgage cost can be used to calculated the total cost of living. Using the average full Social Security income for residents ages 65 and over, as sourced from the Social Security Administration, the cost of living after Social Security benefits can be calculated. Assuming $650,000 in savings, the years to drawdown the savings account can be calculated using the total cost of living after Social Security benefits. Washington, D.C., was included as supplemental information. The states are sorted to show the longest amount of time to drawdown $650,000 in savings. All data was collected on and is up to date as of Aug. 6, 2024.
More From GOBankingRates
- Costco, Walmart and Other Stores With Perks Retirees Need To Be Taking Advantage Of
- 8 Common Mistakes Retirees Make With Their Social Security Checks
- The Trump Economy Begins: 4 Money Moves Retirees Should Make Before Inauguration Day
- 3 Things Retirees Should Sell To Build Their Retirement Savings
This article originally appeared on GOBankingRates.com: How Far $650K Plus Social Security Will Go in Every State
The views and opinions expressed herein are the views and opinions of the author and do not necessarily reflect those of Nasdaq, Inc.


