
Exxon Mobil Corporation XOM has a diversified asset portfolio spread across multiple regions. The company has a presence in both upstream and downstream operations. The majority of its revenues are generated from its upstream business via its advantaged upstream assets.
This leading global energy company is focusing its upstream portfolio on high-quality advantaged assets, such as the Permian Basin, offshore Guyana and LNG projects. The Permian and Guyana assets offer strong production potential and low breakeven costs, generating profit even when crude prices remain soft. The global shift toward cleaner energy is expected to support higher revenues from its LNG portfolio.
By 2030, XOM expects 65% of its output from high-quality advantaged assets, with total production reaching 5.5 million barrels of oil equivalent per day (MMboed), including 2.5 MMboed from the Permian Basin, up from 4.7 MMboed in 2025. ExxonMobil aims to boost profit by more than $14 billion at constant prices from 2024 to 2030. Leveraging these advantaged assets, upstream earnings are projected to see a 12% compound annual growth rate (CAGR).
XOM’s Portfolio Advantage: Can CVX and COP Compete?
Chevron Corporation CVX and ConocoPhillips’COP are two other energy firms with low-cost shale portfolios in the United States to drive competitive advantage. CVX maintains a significant position in the Permian Basin as part of its high-quality assets. Similarly, COP holds a strong presence in the Lower 48 region, which includes substantial operations in the Permian Basin. Like XOM, these low-cost assets allow CVX and COP to sustain profitability and generate substantial free cash flow amid fluctuating oil prices.
XOM’s Price Performance, Valuation & Estimates
ExxonMobil shares have gained 42.6% over the past year compared with the 39.8% return of the composite stocks belonging to the industry.
 Image Source: Zacks Investment Research
From a valuation standpoint, XOM trades at a trailing 12-month enterprise-value-to-EBITDA (EV/EBITDA) of 10.9X. This is above the broader industry average of 6.86X.
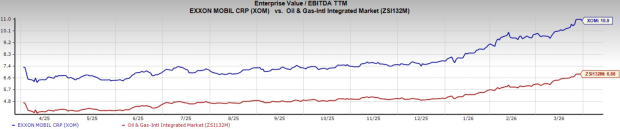
Image Source: Zacks Investment Research
The Zacks Consensus Estimate for XOM’s 2026 earnings has seen upward revisions over the past seven days.
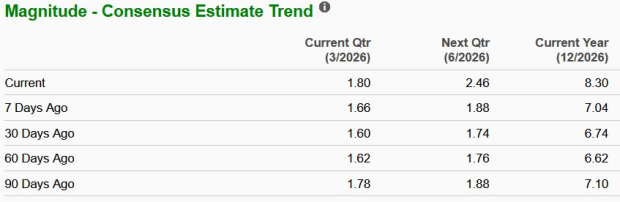
Image Source: Zacks Investment Research
ExxonMobil currently carries a Zacks Rank #3 (Hold). You can see the complete list of today’s Zacks #1 Rank (Strong Buy) stocks here.
5 Stocks Set to Double
Each was handpicked by a Zacks expert as the #1 favorite stock to gain +100% or more in the coming year. While not all picks can be winners, previous recommendations have soared +112%, +171%, +209% and +232%.
Most of the stocks in this report are flying under Wall Street radar, which provides a great opportunity to get in on the ground floor.
Today, See These 5 Potential Home Runs >>Chevron Corporation (CVX) : Free Stock Analysis Report
Exxon Mobil Corporation (XOM) : Free Stock Analysis Report
ConocoPhillips (COP) : Free Stock Analysis Report
This article originally published on Zacks Investment Research (zacks.com).
The views and opinions expressed herein are the views and opinions of the author and do not necessarily reflect those of Nasdaq, Inc.

