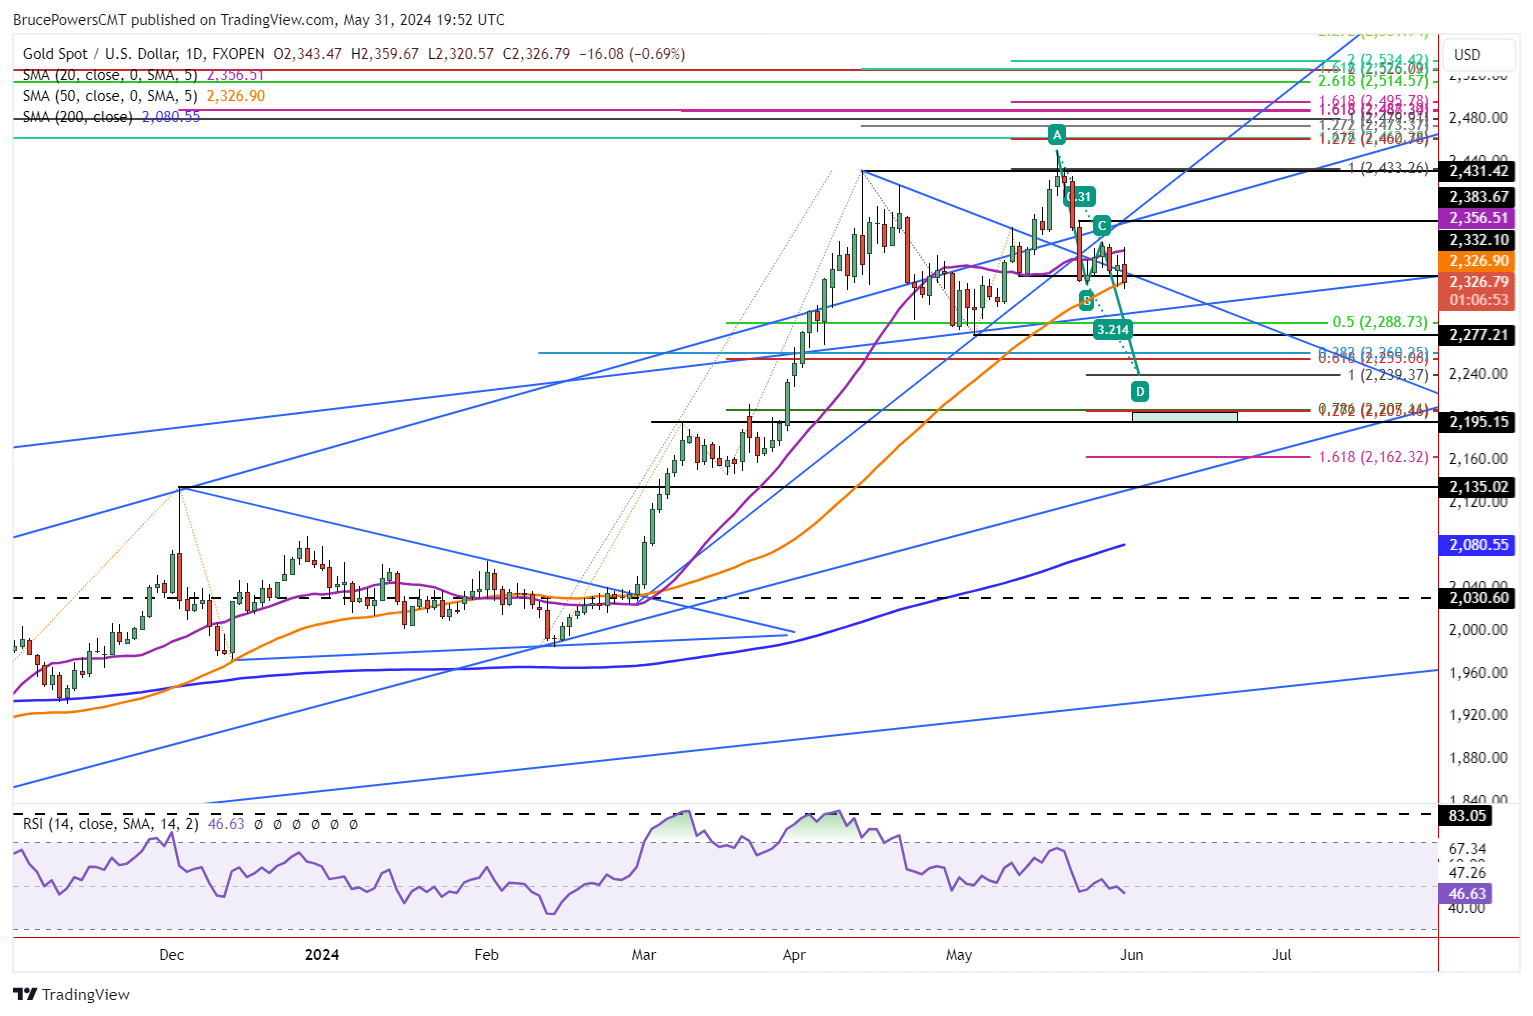
Following a successful test of resistance around the 20-Day MA gold turns down and attacks its 50-Day MA. At the time of this writing gold has reached a low for the day of 2,321 and it continues to trade near the lows. Further, today’s low is a new retracement low as the previous level of 2,322 was busted. It looks like gold intends to test lower price levels unless strong support is seen soon.

Next Possible Support Zone
The next potential support area may be seen around a top rising channel line that is currently near 2,298. If gold drops further below the 50-Day MA and stays below it, the recent swing low of 2,277 is at risk of being broken. There are several lower price areas marked on the chart but let’s start by considering a developing falling ABCD pattern.
A bearish continuation was triggered on Wednesday following a two-day bounce. Subsequently, support was seen around the 50-day line leading to a retest of resistance today and yesterday. Since resistance was followed by a decline today, it looks like the initial target from the pattern at 2,239 could be reached eventually.
Return to Previous Breakout Levels?
Further down is a potentially more significant price zone as it was previously trend highs of a small consolidation pattern. When combined with Fibonacci price levels a potential support zone from 2,207 to roughly 2,195 is indicated. A breakout of that consolidation was the most recent pattern breakout prior to the April 12 swing high. Therefore, that price area would be the maximum decline that may test previous resistance as support.
Weekly Chart is Bearish
The weekly chart is supportive of a deeper retracement as this week is likely to end below last week’s low of 2,325, thereby confirming a weekly bearish continuation signal. It follows a bearish candle from last week when gold also closed near the lows of the week. This means the last two weeks have had a bearish reaction to the new trend high last week. In other words, a failed breakout. Failed patterns frequently lead to sharp moves in the opposite direction.
For a look at all of today’s economic events, check out our economic calendar.
This article was originally posted on FX Empire
More From FXEMPIRE:
- USD/CAD Faces Volatile Week
- Gold (XAU) Daily Forecast: Gaza Ceasefire Optimism; Price Plunge Below $2,320
- Bitcoin (BTC) News Today: Weekend Gains Linked to US BTC-Spot ETF Inflows
The views and opinions expressed herein are the views and opinions of the author and do not necessarily reflect those of Nasdaq, Inc.


