
Gold stalled near trend highs today following a brief new record high of 2,305 reached earlier in Thursday’s trading session. It is on track to close in the red for the day but retains a series of higher daily highs and higher lows. Near-term support is at the day’s low of 2,283. If broken to the downside, a further retracement may be seen.
Pattern Target Reached
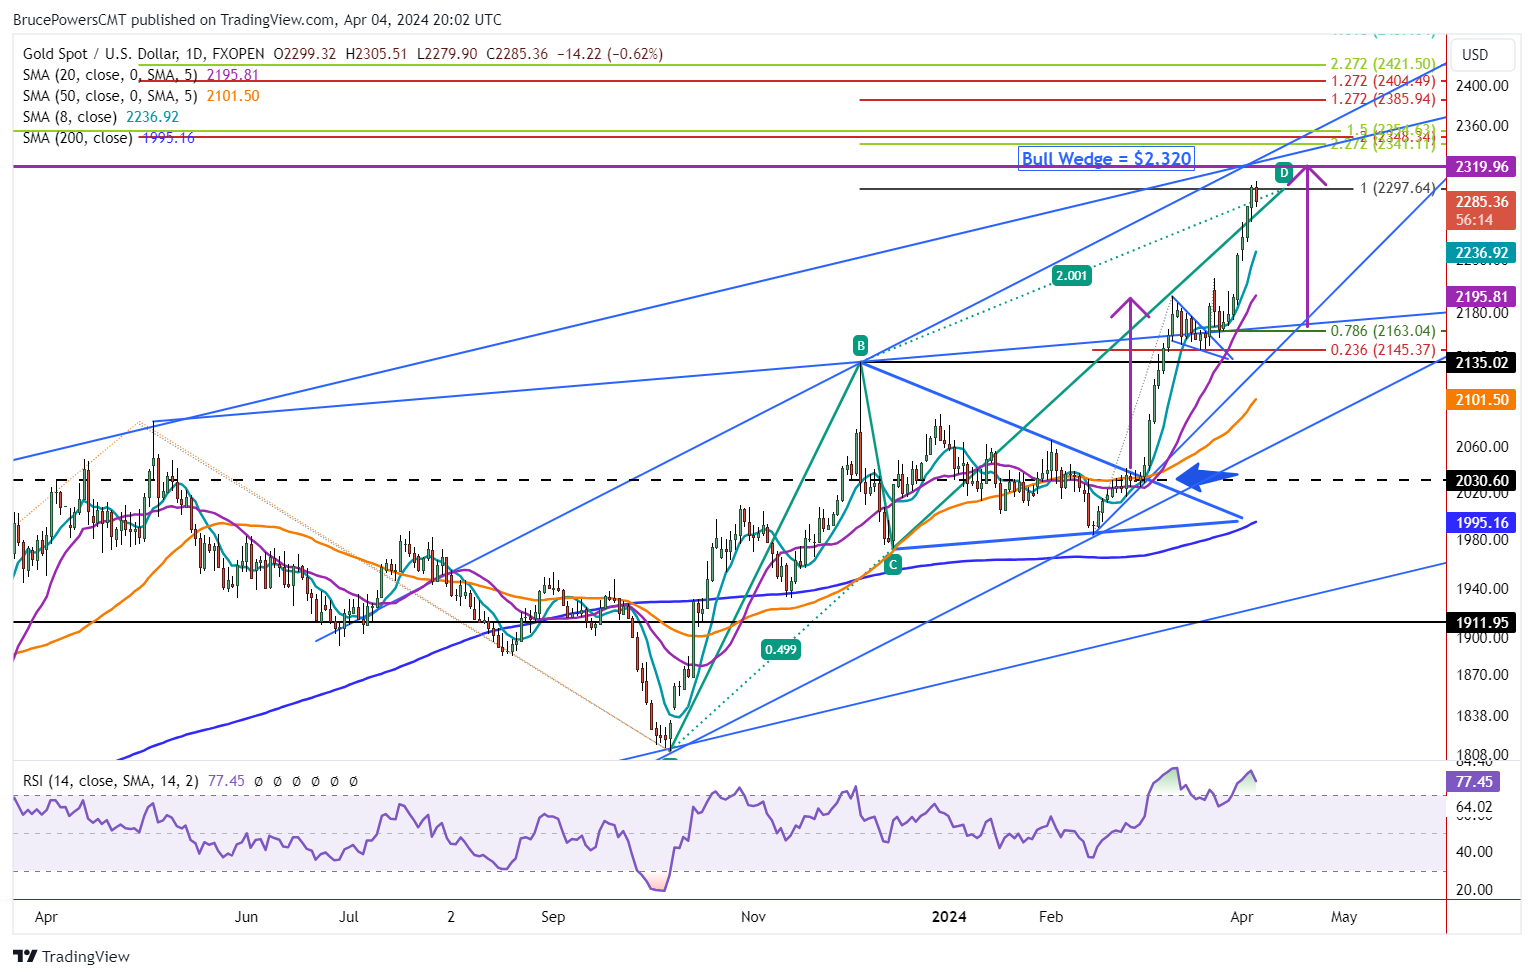
A key target of 2,298 was reached on Wednesday and today’s stall indicates the market seems to be aware of the price level. It completes the CD leg of a large rising ABCD pattern that reflects price symmetry with the AB leg of the pattern. The pattern begins from the swing low last October. As of today’s high, gold was up by 494 points or 27.3% from that low.
Also, it was up by 372 points or 13.6% from the recent symmetrical triangle breakout day low from February 29. Given the long-term nature of this pattern, gold has reached a potential pivot level that could lead to a retracement and end the current sharp advance, at least for the near-term. This doesn’t mean it will do that, just that it is at a decision point.
Next Higher Target is 2,320
Moreover, an advance above today’s high of 2,305, at the time of this writing, indicates the next higher target zone may be reached in the current advance. It comes in a little higher at 2,320. That target is identified as the initial target from the recent bullish falling wedge correction that ended with a minor swing low on March 18. It can be thought of as a measured move. The measured moves are marked with rising purple arrows.
Support Levels if Pullback Triggers
If a correction begins it could be a short term or longer retracement. Some potential support levels to watch include this week’s low at 2,228, followed by the most recent swing high and top of the wedge of 2,195. We may also see a similar pullback to what happened during the two-week correction that formed the falling wedge. It wouldn’t be surprising given the long-term base breakout that confirmed last week.
For a look at all of today’s economic events, check out our economic calendar.
This article was originally posted on FX Empire
More From FXEMPIRE:
- Natural Gas Weekly Price Forecast – Natural Gas Continues to Build a Base
- Natural Price Forecast – Natural Gas Continues to Build Its Floor
- NASDAQ Price Forecast – NASDAQ 100 Continues to See Noisy Behavior
The views and opinions expressed herein are the views and opinions of the author and do not necessarily reflect those of Nasdaq, Inc.

