All About BDCs
Jose Andres Montes Lopez, Specialist of Index Research & Development at Nasdaq
Robert Jankiewicz, CFA, Senior Director of Index Research & Development at Nasdaq
We previously talked about closed-end funds (CEFs) and how they can be a helpful investment wrapper for funds that require a relatively stable pool of capital, especially when investing in less-liquid securities. In that report, we focused on traditional (listed) CEFs, which accounted for over $250bn in assets as of year-end 2025.
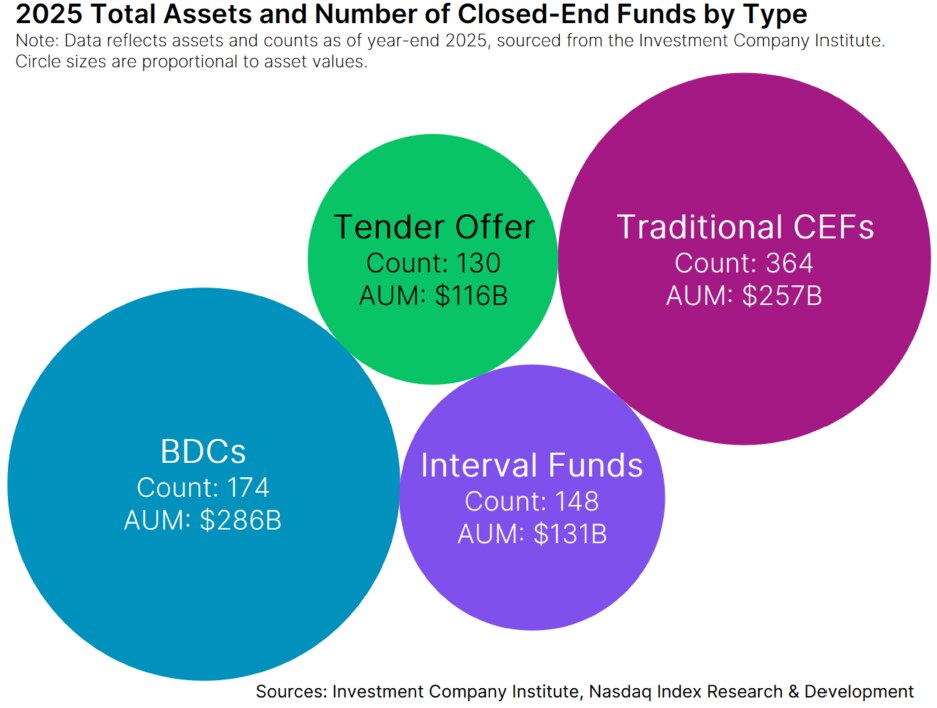
However, taking a closer look, the closed-end fund universe extends well beyond traditional listed CEFs. According to Investment Company Institute (ICI) data, the market encompasses nearly $800bn in assets across several fund structures including interval funds, tender offer funds, and business development companies (BDCs).
In today’s report, we delve deeper into BDCs, a significant segment of the closed-end fund market that provides financing to small and middle-market businesses while offering investors access to private credit exposures.
How many total CEFs are there?
In our last report, we saw that there were around 364 traditional CEFs, representing around $260bn in net assets as of year-end 2025, according to ICI. However, traditional CEFs are only one subset of the broader CEF landscape, which represents nearly $800bn in net assets. In fact, we see that interval funds, tender offer funds, and BDCs account for an additional $533bn in net assets in the closed-end fund universe (Chart 1).
Chart 1: Closed-End Fund Subtypes
Compared to traditional CEFs, which raise a fixed amount of capital through an IPO and trade on exchanges without issuing new shares, interval funds and tender offer funds are generally unlisted and do not trade in secondary markets.
Instead, those funds offer liquidity through periodic, scheduled, repurchases (interval funds), or through discretionary repurchases (tender offer funds). Historically, interval funds and tender offer funds have accounted for $247bn in net assets, spread across 278 funds (Chart 2).
Chart 2: Count of Total CEFs Through Time
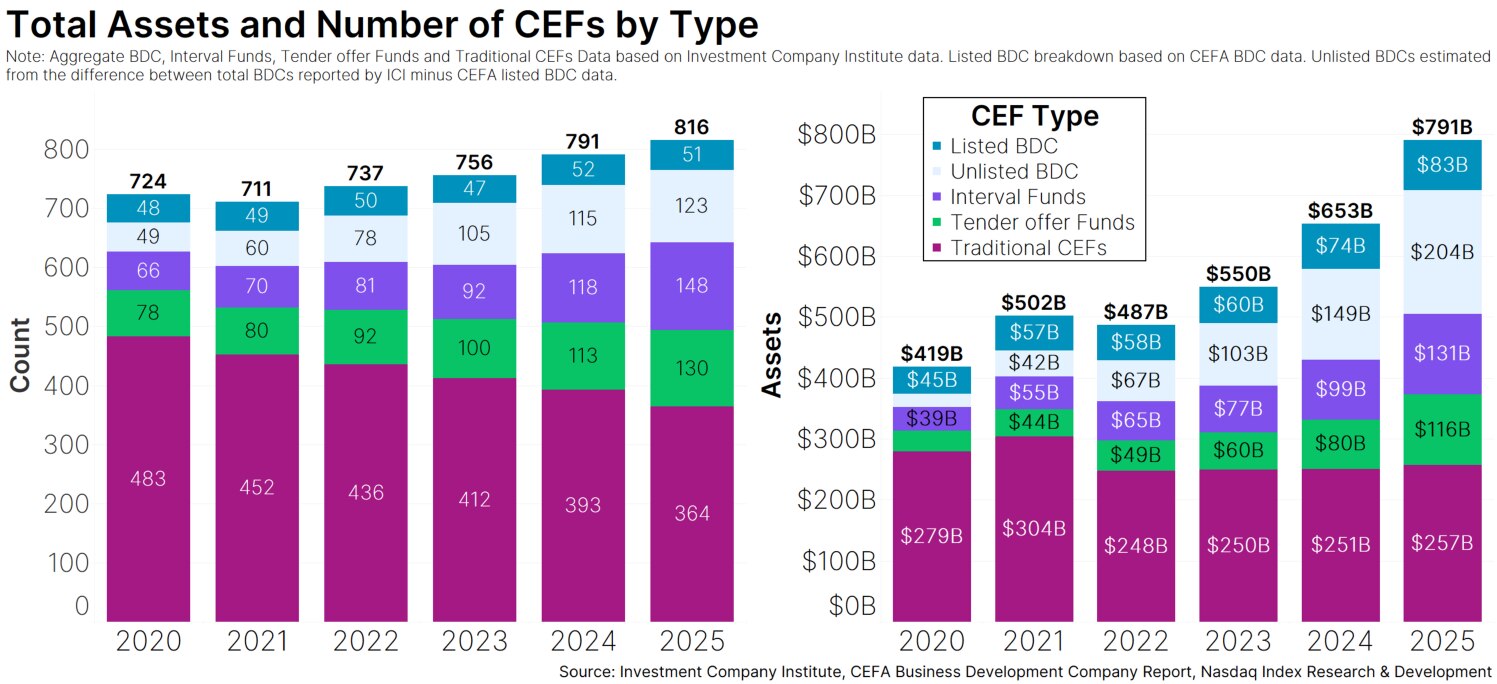
BDCs, on the other hand, may be listed or unlisted (more on this later). According to ICI, there were over 170 total BDCs (both listed and unlisted), representing nearly $300bn as of year-end 2025 (Chart 2). Both types have experienced significant growth in assets in recent years, rising from $67bn to $287bn between 2020 and 2025.
As we will learn next, there are other features that make BDCs even more specialized from the broader CEF market.
What is a BDC?
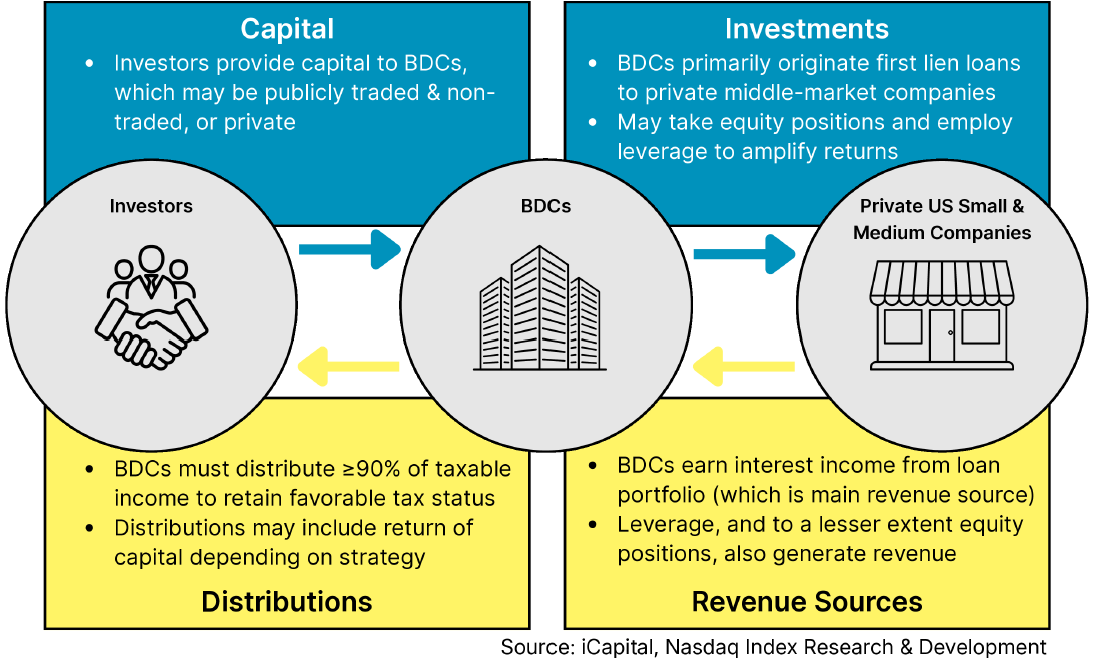
At its core, a BDC is a lending company. The BDC raises capital from investors (like other CEFs) and uses it to invest - typically through loans - in target companies. In return, the BDC earns interest on those loans and passes that income to investors (Chart 3).
Chart 3: BDC Flow Chart
BDCs were created in 1980 with the intent of supporting small and middle-market companies (companies that generally earn between $10m and $1bn in annual revenue). In fact, BDCs are required to invest at least 70% of their assets in domestic U.S. companies with market capitalizations of $250 million or less (which are considered ‘eligible companies’).
Unlike other CEFs, BDCs are not registered investment companies under the Investment Company Act of 1940 (the 1940 Act). However, BDCs elect to be regulated by the SEC under certain provisions of the 1940 Act and thus operate as Regulated Investment Companies (RICs) In addition to the pass-through tax treatment of typical RICs, BDCs receive greater operational flexibility - including higher leverage limits and more lenient compensation rules among other benefits.
However, unlike other RICs, BDCs are mandated to invest in small and middle market U.S. companies (as noted above), offer "significant managerial assistance" to their portfolio companies, and abide by other requirements.
Additionally, not all BDCs are the same. As shown in Chart 4, they differ across structure, liquidity, reporting, eligibility, pricing, and lifecycle.
Chart 4: Public vs Private BDC Characteristics
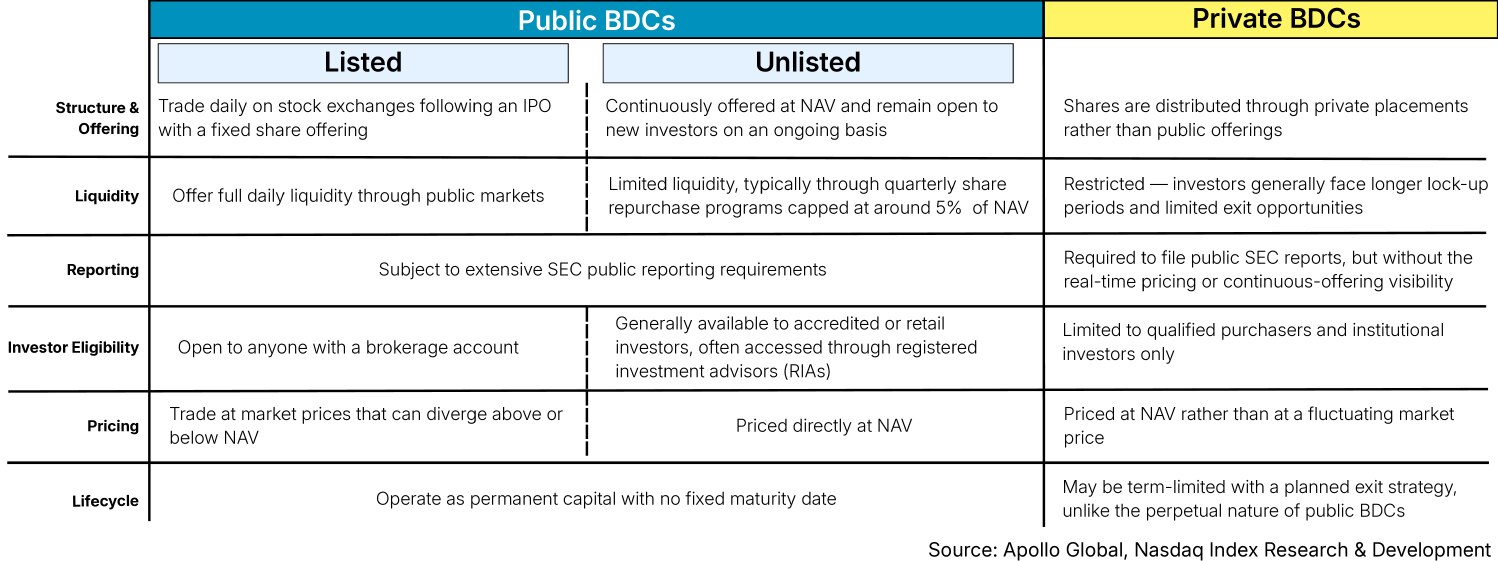
BDCs may also be public, or private. However, as we can see above, even public BDCs can differ in their characteristics depending on whether they are listed or unlisted.
How do BDCs generate returns?
BDC returns are generally driven by income from debt investments, the effects of leverage, and in some cases the returns from equity investments.
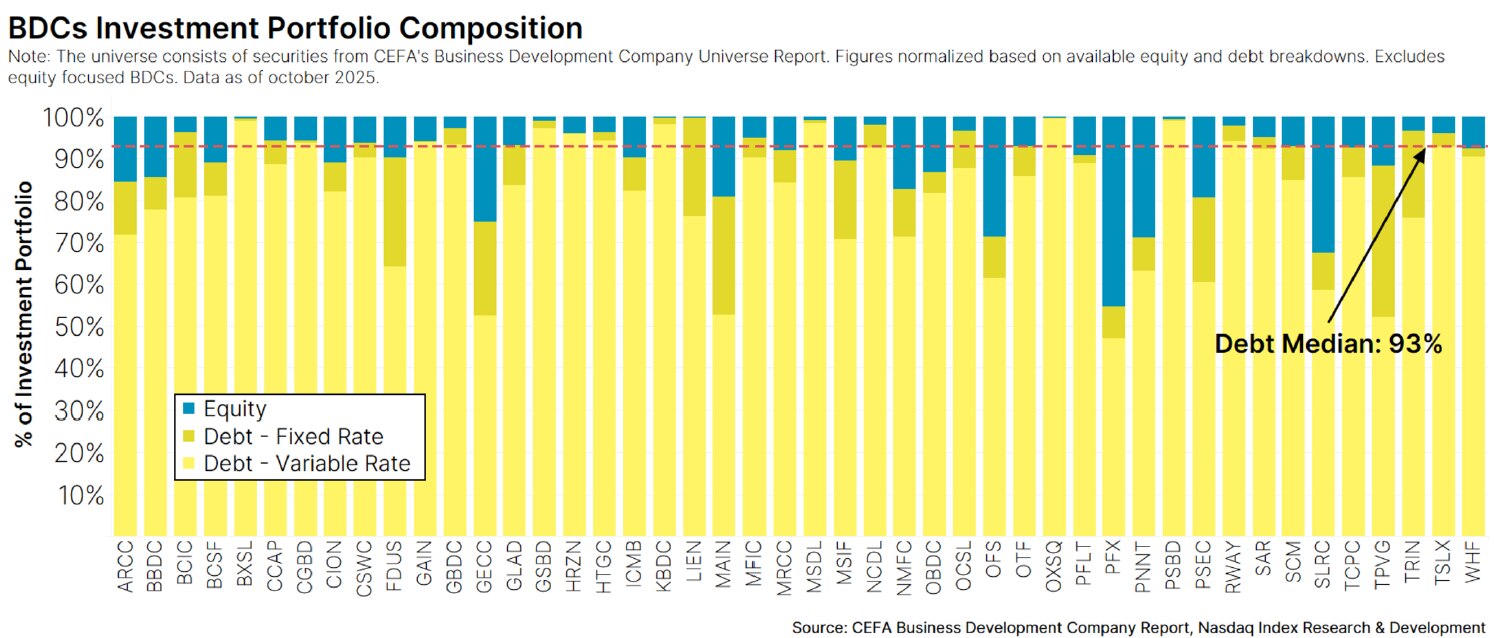
Interest income from debt investments represents the primary source of income for most BDCs. Using data on publicly listed BDCs as of October 2025, we see that the assets of the median BDC are composed of over 90% debt, most of which is floating-rate (Chart 5).
Chart 5: Composition of BDC Investment Portfolio
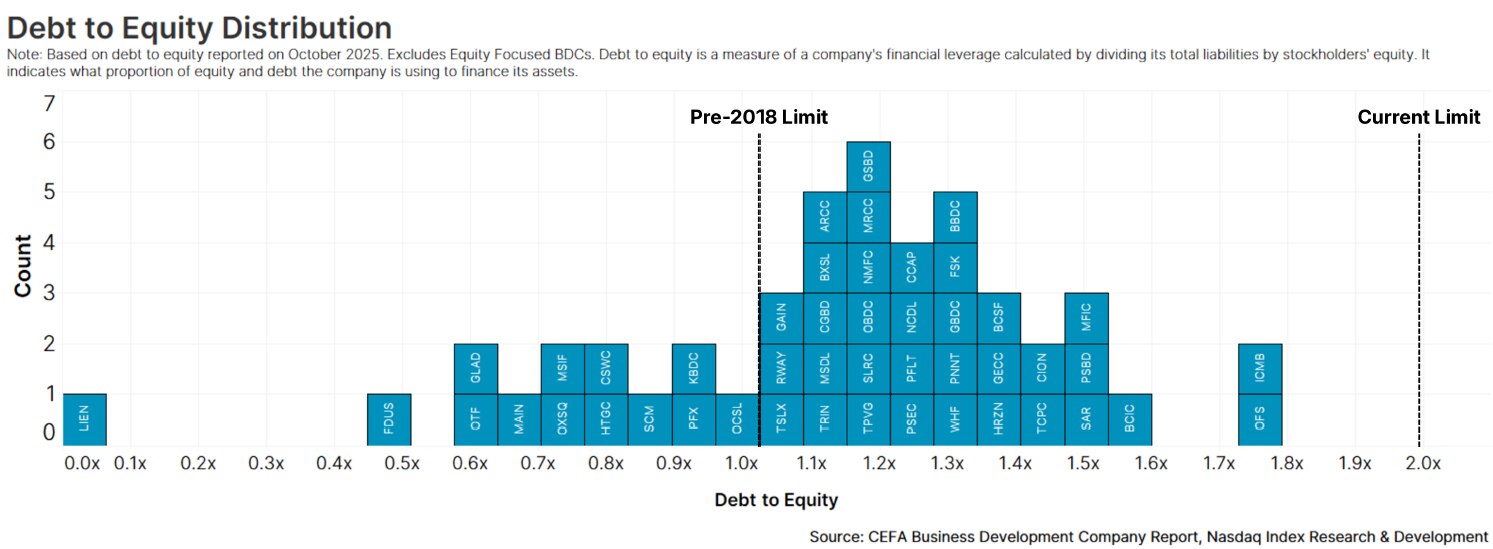
Historically, leverage has been an important contributor to BDC returns. According to the 2018 Small Business Credit Availability Act (SBCAA), BDCs are allowed to run a maximum debt-to-equity ratio of 2.0x (a limit that was raised from 1.0x in 2018). As of October 2025, we see that the typical public BDC has a debt to equity ratio of 1.2x (Chart 6).
Chart 6: How Leveraged are BDCs?
BDCs employ several forms of leverage, most commonly through credit facilities and public or private notes, depending on whether their funding needs are short- or long-term. Given that BDCs must borrow to make their investments, the cost of debt can weigh on a fund’s net performance. For example, using a single BDC’s recent quarterly filing, we can visualize how the cost of debt and the impact of leverage influence overall results.
Starting on the left side of Chart 7, we see that the annualized investment income relative to total assets was around 9.9%. As opposed to traditional top-line revenue for many companies, the primary driver of income for BDCs is the interest income earned from investments in underlying companies.
Chart 7: Sample Components of BDC Returns
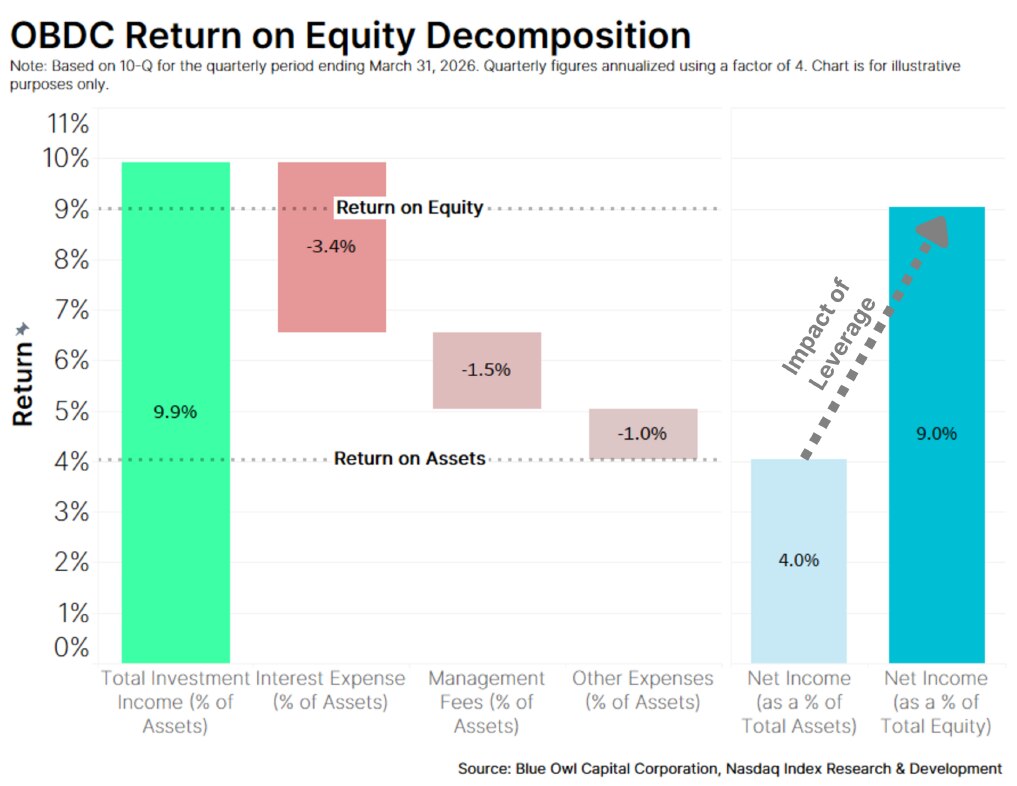
Normalizing by total assets, we see that the cost of debt, management fees, and other operating expenses reduced total investment income by about half, leading to a “return on assets” of around 4%. Relative to net assets, or equity (total assets minus total liabilities), however, net income was roughly 9%- illustrating the meaningful impact of leverage (blue bars in Chart 7).
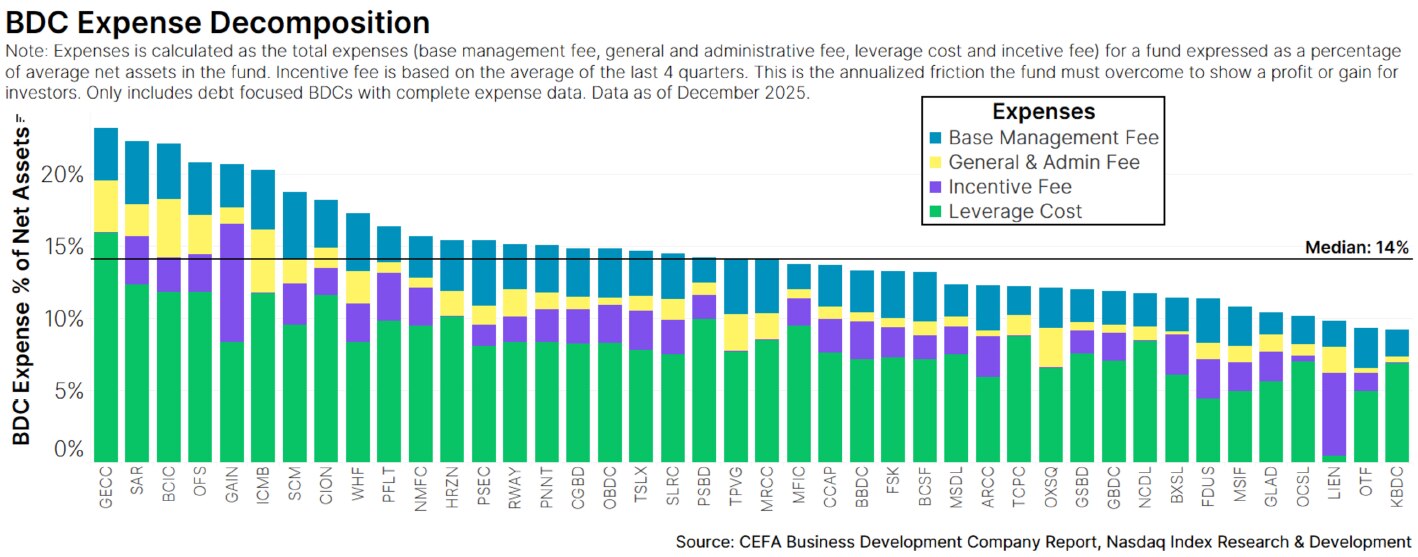
In fact, when we expand the analysis to all listed BDCs in terms of net assets we see a similar picture. Chart 8 below presents each BDC's expenses as a percentage of net assets on an annualized basis. While leverage costs represent the largest expense category, other fees—particularly incentive fees—can also be substantial. For example, according to general guidelines from an SEC report, "certain incentive fees generally up to 20% of any profits earned" are layered on top of leverage costs, general and administrative expenses, and management fees. On the whole, the typical BDC incurs expenses equivalent to roughly 14% of its net assets (Chart 8).
Chart 8: Expenses of BDCs
These expenses can also influence other funds that hold BDCs as investments. Since a BDC is considered a fund, any other registered fund (like an ETF) that holds a BDC is considered a “fund-of-funds,” and is thus required to report any indirect expenses inherited from the underlying fund holdings. These indirect fees show up on an ETF’s prospectus as acquired fund fees and expenses (AFFE), which can make reported expense ratios seem relatively high. For example, Chart 9 below highlights a sample of U.S. listed ETFs that include around 20% or more direct BDC exposure. Note that some funds, such as PBDC, FBDC, BIZD, or VPC, each of which allocate 50% or more to BDCs, report expense ratios that are around 10% or higher.
Chart 9: Expense Ratios of ETFs Holding BDCs
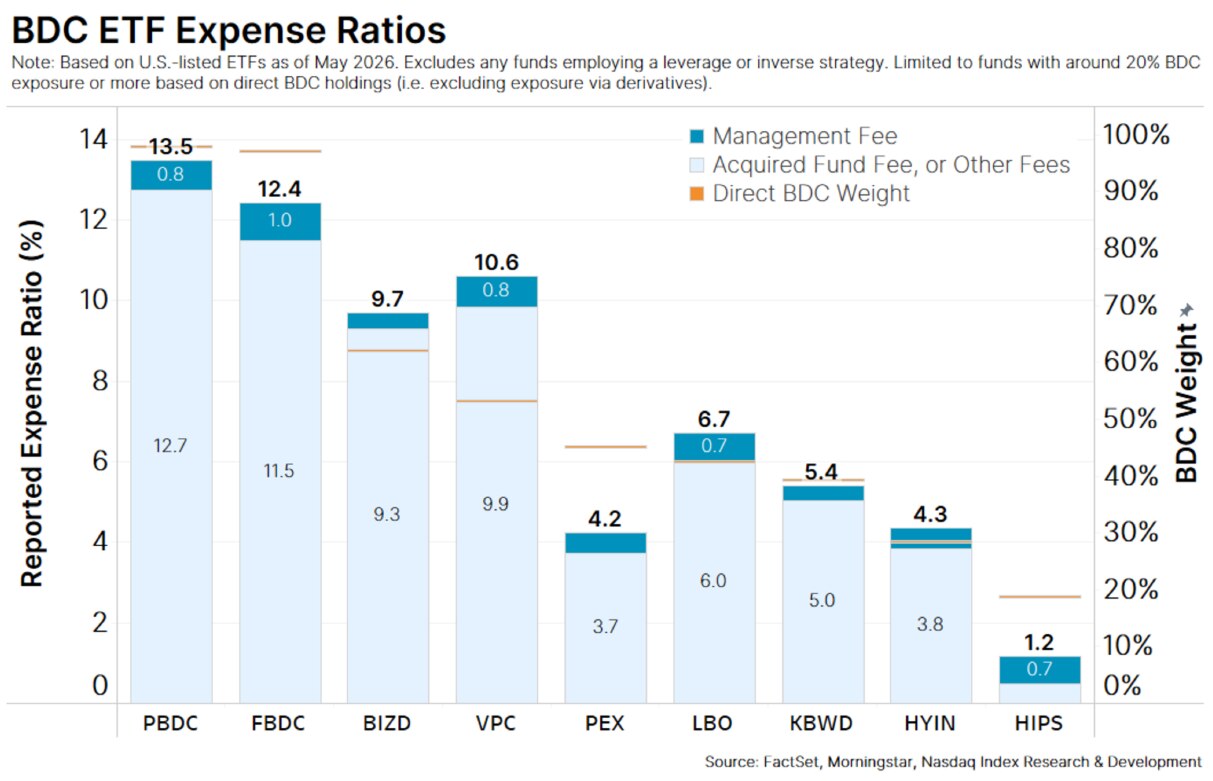
At first glance, this reported fee may seem extremely high, compared to the typical ETF which charges only around 30 bps (0.30%). However, we see that the majority of the fee is due to the acquired fees, while the true management fees sit closer to 60 bps.
How do BDCs perform?
Given the amount of variable rate debt on their balance sheets (Chart 5), BDC performance is generally interest-rate sensitive. To examine this relationship, we backtested a portfolio of publicly listed BDCs to assess performance.
Chart 10 below illustrates the relative performance of BDCs versus U.S. treasuries (proxied by TLT) compared to U.S. 10-year yields. Notably, BDCs tend to outperform treasuries when yields are rising, but generally underperform when yields fall.
Chart 10: BDC Performance vs. Interest Rates

Interestingly, BDCs also tend to track private credit performance. For example, Chart 11 below compares the returns of BDCs (described above) to those of the Nasdaq Private Capital – Private Debt GlobalTM Index (NPCPDTM), a private credit benchmark. Despite NPCPD's quarterly marks, BDCs have historically exhibited similar performance to the benchmark—except during stress periods, when they're more volatile. This alignment reflects the structure of a typical BDC's underlying assets, as noted earlier.
Chart 11: BDC Performance vs. Private Credit

Conclusion
BDCs represent a subset of the closed-end fund universe, sitting between public markets and private credit. By extending loans mainly to small and middle-market private U.S. companies, BDCs provide access to a unique and otherwise difficult to access asset class. While BDCs make this asset class more accessible, investors should still develop a clear understanding of their structure, return drivers, and fees to properly evaluate their performance.
Disclaimer:
Information set forth in this communication contains forward-looking statements that involve a number of risks and uncertainties. Nasdaq cautions readers that any forward-looking information is not a guarantee of future performance and that actual results could differ materially from those contained in the forward-looking information. Forward-looking statements can be identified by words such as “will,” “believe” and other words and terms of similar meaning. Forward-looking statements involve a number of risks, uncertainties or other factors beyond Nasdaq’s control. These risks and uncertainties are detailed in Nasdaq’s filings with the U.S. Securities and Exchange Commission, including its annual reports on Form 10-K and quarterly reports on Form 10-Q which are available on Nasdaq’s investor relations website at http://ir.nasdaq.com and the SEC’s website at www.sec.gov. Nasdaq undertakes no obligation to publicly update any forward-looking statement, whether as a result of new information, future events or otherwise.
Nasdaq®, Nasdaq Private Capital – Private Debt GlobalTM, NPCPD™ are registered and unregistered trademarks of Nasdaq, Inc. The information contained above is provided for informational and educational purposes only, and nothing contained herein should be construed as investment advice, either on behalf of a particular security or an overall investment strategy. Neither Nasdaq, Inc. nor any of its affiliates makes any recommendation to buy or sell any security or any representation about the financial condition of any company. Statements regarding Nasdaq-listed companies or Nasdaq proprietary indexes are not guarantees of future performance. Actual results may differ materially from those expressed or implied. Past performance is not indicative of future results. Investors should undertake their own due diligence and carefully evaluate companies before investing. ADVICE FROM A SECURITIES PROFESSIONAL IS STRONGLY ADVISED.
© 2026. Nasdaq, Inc. All Rights Reserved.