Reshaping the Nasdaq-100®: AI CapEx, Leverage Dynamics and What it Means for Investors
Mark Marex, CFA, Global Head of Nasdaq Index Insights
Sal Bruno, CETF®, Senior Director, Head of Americas Nasdaq Index Insights
Sanjana Prabhakar, Senior Specialist, Nasdaq Index Insights
Key Takeaways
- AI-related capital expenditure is a historic, multi-year investment cycle—projected at roughly $700B by 2026—that is reshaping the Nasdaq-100’s (NDX®) fundamentals and market leadership1.
- The Nasdaq-100’s AI exposure is broader than headline hyperscalers: semiconductors, cloud/platform providers, networking/utilities, and AI adoption beneficiaries each represent distinct risk/return profiles across the AI value chain.
- The AI CapEx wave has contributed to increasing stock-level dispersion and market concentration, as investors differentiate between AI “enablers” and “deployers” and reprice companies based on evidence of execution.
- Markets are shifting from rewarding “spend now, monetize later” narratives to prioritizing monetization timelines—especially ROIC, operating leverage, and free cash flow—when assessing elevated AI investment plans.
- Despite rising AI investment and some increased debt issuance, leverage ratios for the Mag 7 and the Nasdaq-100 have remained stable to improving, supported by strong profitability and operating cash flow.
Tracking artificial intelligence (AI)-related capital expenditure (CapEx) is critical as it represents a massive, transformative investment cycle – on track for nearly $700 billion by 2026 – that will potentially impact the relative standing of many of the world’s largest companies, from both a market performance and fundamental growth perspective. The AI infrastructure buildout is among the largest and fastest in history, driven by competition for AI dominance among the five major “hyperscalers” (Nasdaq-listed Microsoft, Google, Meta and Amazon, and NYSE-listed Oracle). This continues to act as an economy-wide stimulus, in particular supporting revenue and earnings growth for the hyperscalers as well as the broader ecosystem of technology hardware and cloud infrastructure providers.
How AI capital expenditure spending is reshaping the Nasdaq-100®
The Nasdaq-100® is considered the epicenter of the AI capital expenditure cycle, with several of its leading constituents driving a massive, unprecedented wave of investment. Companies that make up the index are disproportionately building both the infrastructure and developing the applications to support AI technological advancement, deployment, and adoption. The current AI capital expenditure cycle is already being considered historic in its scale and duration, on par with some of the largest investment cycles ever undertaken. While major technology firms have been investing in R&D for years to stay competitive, current investments are increasingly going beyond software and other intangible assets into the physical realm, driving record demand for semiconductors, datacenter construction, power infrastructure, and networking gear, among others. Some of this investment may not immediately translate into profits, resulting in a monetization lag and potential for increased volatility in the markets. Investor attention has been shifting towards long-term ROIC (Return on Invested Capital) to evaluate capital efficiency.
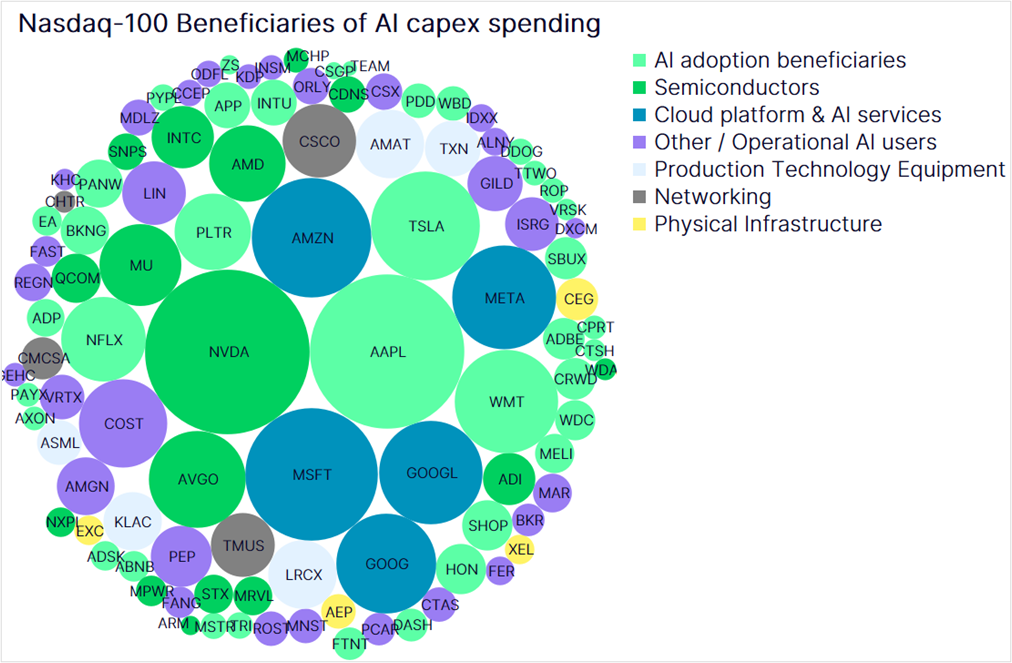
Major players within the Nasdaq‑100 include the aforementioned hyperscalers—Amazon, Alphabet, Meta, and Microsoft—which are rapidly scaling AI CapEx spending to a projected ~$700 billion by 2026, representing a 60%-70% increase over 2025 levels2. There are, however, multiple groups of companies actively participating in the AI value chain. The chart below classifies companies within the Nasdaq-100 into different sub-groups, including Semiconductors, Production Technology Equipment, Cloud Platform & AI Services, Networking, Physical Infrastructure, AI adoption beneficiaries and Other/Operational AI Users3. These categories were created by mapping the AI value chain - from the “picks & shovels” operators to the final “users” and “workflow enhancers”. These subgroups illustrate that while semiconductor firms are the most immediate beneficiaries, the index’s exposure to broader AI CapEx is more multidimensional than what headlines sometimes suggest.
- Semiconductor companies (total index weight of 27.3%) are critical beneficiaries, as they design, manufacture and provide the equipment essential for making chips that support AI workloads.
- Cloud platform and AI service providers, with a total index weight of 20.3%, provide the infrastructure and tools to build, deploy and manage AI models. These include Microsoft, Amazon, Google and Meta.
- Physical Infrastructure and Networking, with a total index weight of 5.3%, provide the power to handle the massive energy and data demands of artificial intelligence and have a smaller representation within the Nasdaq-100. These include Cisco Systems, Comcast, and American Electric Power among others.
- Finally, companies demonstrating productivity gains from AI adoption, where AI has translated into improved efficiency, higher revenue per worker, and greater operating leverage, also stand to benefit. Importantly, the Nasdaq-100 contains a growing set of AI adoption beneficiaries, with a total index weight of 31.6%. These include companies such as Airbnb, Crowdstrike Holdings, Palo Alto Networks, and Paychex among others.
- Other operational AI users are not primary recipients of AI capital expenditure, with a total index weight of 15.5%, but they are critical to the long‑term investment case for AI. These include companies in technology-forward industries such as pharmaceuticals, retail and e-commerce that are integrating AI into core workflows. They contribute to the transition of AI from experimental pilots to enterprise-wide operations and prove that AI provides tangible financial value.
The AI-driven CapEx cycle has somewhat altered the internal structure of the Nasdaq-100’s performance. The index can increasingly be viewed through the lens of CapEx spenders, CapEx beneficiaries, and CapEx laggards, leading to higher stock‑level dispersion4,5. At the same time, the scale of AI infrastructure investment has weakened the index’s historical characterization as a capital‑light growth benchmark. Upside for the Nasdaq‑100 has become more multidimensional than in the past, increasingly dependent on tangible AI outcomes—including ROIC, operating leverage, and free cash flow—rather than on revenue and earnings growth alone. As AI‑related CapEx is more front‑end loaded while monetization is more back‑end loaded, the near‑term impact of these allocations is raising pressure on free cash flow. As a result, markets have become less tolerant of “spend now, monetize later” narratives and are increasingly sensitive to changes in CapEx guidance, even when demand trends remain intact.
Financing of AI CapEx and its implications for leverage ratios
The Magnificent Seven (Mag 76) are projected to spend more than $700 billion on 2026 capital expenditures, with investment overwhelmingly directed toward AI chips, physical construction of datacenters, and supporting infrastructure such as networking gear. Amazon, at roughly $200 billion, is the largest absolute spender, with incremental CapEx dominated by both externally-sourced chips and internally-developed custom silicon for Amazon Web Services (AWS), its cloud computing and storage business. Alphabet is guiding to $180–$190 billion, nearly doubling its investment versus prior years as it accelerates datacenter and custom silicon buildouts. Microsoft, at approximately $190 billion, is operating with one of the highest CapEx‑to‑revenue ratios in its history, reflecting sustained AI‑driven demand for Azure cloud capacity. Meta Platforms, at roughly $125 billion, stands out for having among the fastest year‑over‑year CapEx growth rates, tied to large‑scale AI datacenter expansion. In contrast, Apple remains comparatively CapEx‑light, while Tesla’s investment (~$25 billion) is modest relative to peers. Nvidia, meanwhile, is a primary beneficiary of Mag 7 CapEx rather than a major spender itself, capturing downstream demand through GPUs and other AI accelerators7. Notwithstanding their CapEx spending forecasts, all seven firms remain on track to spend heavily on R&D, with a total projected spend of $358.3 billion in 20268.

The hyperscalers have historically funded capital expenditure primarily through internally generated cash. Hyperscalers' combined cash flow increased by 21% year-over-year to $492 billion in 2025, which was sufficient to cover their capital expenditures of $382 billion for the same year. The unprecedented scale of AI investment, however, has required them to increasingly tap into corporate debt markets and private credit. Hyperscaler debt issuance roughly doubled to $182 billion in 2025, up from $92 billion the previous year. Of the $182 billion, hyperscalers (Amazon, Alphabet/Google, Meta, Microsoft, and Oracle) issued roughly $121 billion in new debt themselves. The remaining roughly $60 billion was raised by private equity-backed firms and infrastructure lenders9.These debt issuances point to a shift from largely self-funded to partially debt-dependent growth for major technology firms. While there is a shift towards funding CapEx with more debt, fundamentals of hyperscalers differ materially partly due to varying levels of leverage assumed. As a case in point, Oracle’s underlying fundamentals differ from Nasdaq-listed hyperscalers, primarily due to higher financial leverage and relatively accelerated CapEx plans to build AI infrastructure when compared to other hyperscalers. It carries a relatively small equity base ($20 bn) compared to Microsoft or Google (<$340 bn). The company’s negative trailing 12-month free cash flow underscores a clear divergence in fundamentals, standing at -$24.7 billion. Consensus estimates suggest that hyperscalers' capital expenditures will approach 90% of their operating cash flow by Q1 2027, which would be on par with the Shale investment cycle (2008-2014) and Telecom investment cycles (1996-2000).
As seen in the charts below, the total debt/equity and total debt/total asset ratios of the Mag 7 have been trending lower or have remained stable over the last 10 quarters. This suggests that the AI capital expenditure cycle has not translated into higher balance sheet risk – at least for the Nasdaq-listed hyperscalers that are part of NDX. While CapEx booms have been historically accompanied by rising leverage and deteriorating fundamentals, the current AI CapEx cycle bucks the trend with balance sheets strengthening for the overall group of Nasdaq-listed megacaps, despite an overall increase in debt.
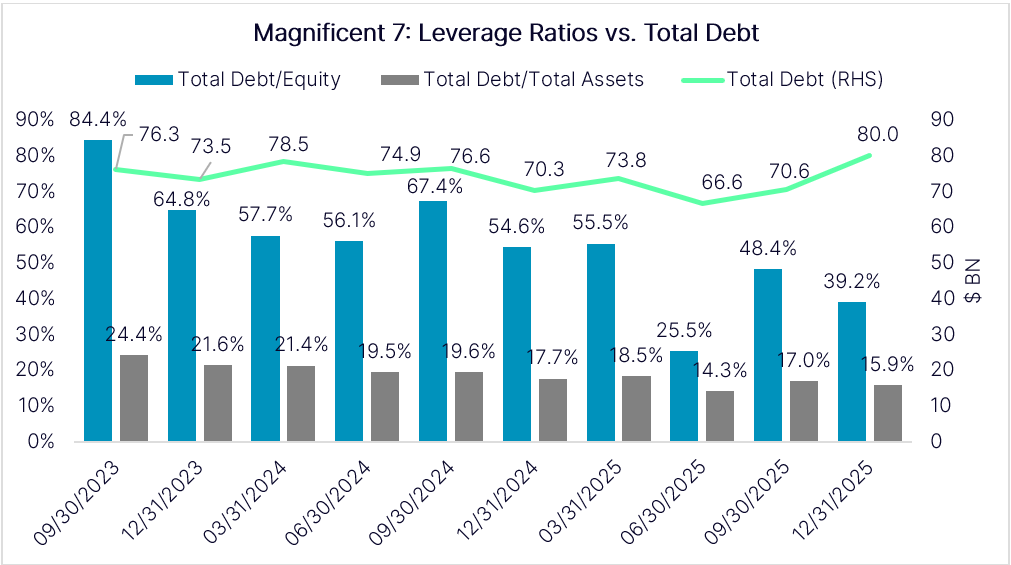
Among the Mag 7, Alphabet, Meta, Microsoft and Amazon have meaningfully raised their debt levels, while Nvidia and Tesla have maintained or modestly reduced their debt levels. Despite rising debt levels, the Mag 7 group remains extremely profitable, with average profit margins of 28.1% in 202510 and strong cash flow generation. In our view, this should help continue to keep leverage ratios fairly stable amidst increased borrowing, while also keeping borrowing rates in check.
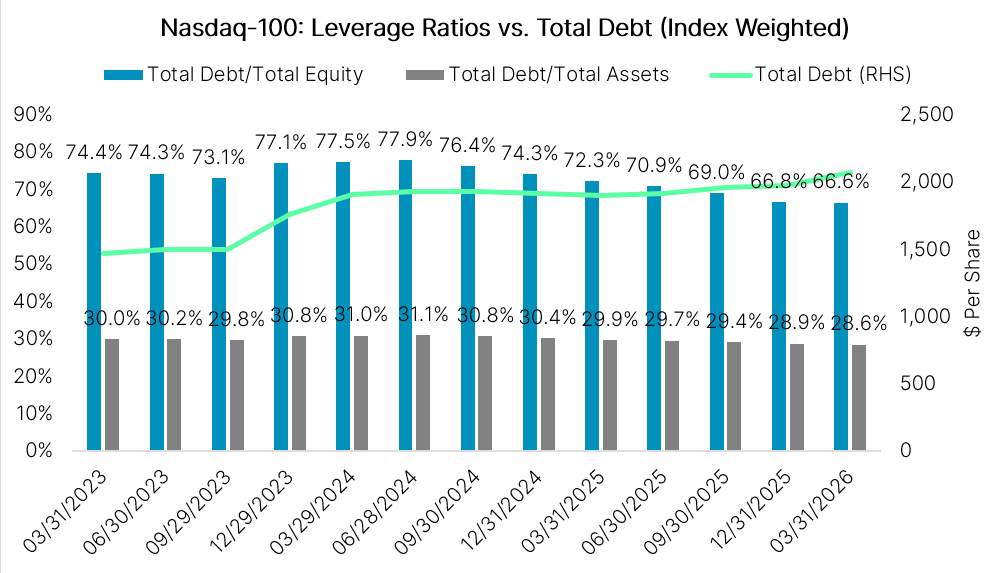
As seen below, the total debt/equity and average total debt/total asset ratios of the Nasdaq-100 have also been trending lower or have remained stable. This makes intuitive sense, given the trend observed in the leverage ratios of the Mag 7, which are funding a vast majority of the current AI infrastructure boom and therefore exert a disproportionate influence on index-level balance sheet metrics.
History Rhymes: What Past CapEx Cycles Reveal About AI
History offers useful lessons for interpreting the current wave of AI CapEx. Past investment cycles demonstrate that rapid increases in capital spending can drive strong growth in specific sectors in the early stages, but persistently elevated levels of CapEx can lead to overcapacity in the later stages. As the investment boom matures, markets tend to become more discerning, rewarding companies that are able to monetize the new technology the quickest. Returns can evaporate if expectations do not align with fundamentals. These historical patterns provide context for evaluating the current AI-driven cycle. During the late 1990s dotcom/telecom boom, tech/telecom CapEx surged, with tech investment rising to >1.5% of US GDP at the cycle’s peak. As of early 2026, technology CapEx represents around 2% of U.S. GDP in 2026, exceeding late 1990 levels. Many telecom and dot-com stocks imploded when expected internet revenues failed to materialize, wiping out approximately $5 trillion in market capitalization11. The 1868-1873 railway expansion saw massive investment in physical infrastructure that revolutionized the economy, similar to how AI CapEx is building futuristic infrastructure with the ability to significantly raise global productivity.
In the current cycle, markets have already experienced periodic pullbacks tied to concerns about overinvestment. For example, in January 2025, there was a brief, intense sell-off, triggered by the release of low-cost models by Chinese AI startup DeepSeek, which challenged the capital-intensive approach of U.S. tech giants. In the years following the launch of ChatGPT, the market has experienced a few other short, periodic corrections driven by AI-related sentiment fears – such as circular financing deals and ROI concerns – as well as longer correction episodes driven by broader macroeconomic pressures including elevated interest rates in 2023-2024, the change in tariff policies in 2025, and the Iran conflict in 2026. None of these three longer, deeper corrections was driven by doubts about the technology itself, rather they were largely macro sentiment driven. On the other hand, the software bear market that followed the release of advanced AI agents in late 2025 reaffirmed the disruptive potential of AI, seemingly justifying the massive investment in real time.
In summary, the current AI-driven CapEx cycle assumes great significance and is comparable to the biggest investment booms of the past – but it differs in composition and context. It is largely led by a handful of profitable tech giants with sufficient cash flow generation rather than hundreds of speculative startups that were unproven from a profitability standpoint, or massively overleveraged telecom giants. These differences may provide a degree of insulation against the sector-wide drawdowns that characterized the dot-com bust.
1 https://www.bloomberg.com/news/articles/2026-04-30/us-big-tech-ratchets-up-ai-spending-past-700-billion-this-year
2 https://fortune.com/2026/04/30/big-tech-hyperscalers-will-spend-700-billion-on-ai-infrastructure-this-year-with-no-clear-end-in-sight-eye-on-ai/
3 Classification of companies into different sub-groups is based on publicly disclosed information from company websites, Bloomberg and Nasdaq Global Indexes
4 https://www.goldmansachs.com/insights/articles/why-ai-companies-may-invest-more-than-500-billion-in-2026
5 https://www.blackrock.com/us/financial-professionals/insights/ai-war-and-income
6 Magnificent 7 companies include Alphabet (GOOGL), Amazon (AMZN), Apple (AAPL), Meta Platforms (META), Microsoft (MSFT), Nvidia (NVDA) and Tesla (TSLA)
7 https://finance.yahoo.com/news/mag-7-ai-arms-race-131300365.html
8 Factset
9 https://www.cnbc.com/2025/12/19/data-center-deals-hit-record-amid-ai-funding-concerns-grip-investors.html
10 Profit margins of Mag 7 indicated for 2025, as per Bloomberg
11 https://internationalbanker.com/history-of-financial-crises/the-dotcom-bubble-burst-2000/