

Key Points:
- “K-shaped” indicators taking further shape & delayed government data likely to reinforce this wedge
- Despite another strong earnings season, markets on edge around AI & hyperscaler trade. Important to keep a long-term view: equities higher 78% of the time since 1980
- Small vs. large U.S. bank trends also indicative of divergences
Summary
Our September 12th report discussed the bifurcations between the real and market economies. This wedge has only widened, particularly given the impact of the record 43-day U.S. government shutdown on the economy and broader sentiment. The “K-shaped” reference is admittedly reaching a point of over saturation—a Google Trends search shows the term hitting “peak popularity” the first week of November. However, it is still apropos when analyzing and comparing the current states of the U.S. economy and equity markets.
Much as investors would like to see a sustainable broadening of equity leadership and earnings growth, wider participation from U.S. consumers and companies would also be a healthy development. The heavy lifting for U.S. consumer spending has continued to be done by the higher earning and wealthier cohort.
This has likely been exacerbated by the powerful equity rally since the April 8th lows driven by the AI ecosystem: J.P. Morgan Chase economists estimate that gains in a group of the top 30 AI-related stocks in their analysis have added around $5 trillion to household wealth over the past year. Yet this is not benefiting the masses as the top 10% of the wealthiest Americans own around 87% of U.S. corporate equities and mutual funds.
Q3 2025 earnings were strong (again) as the blended growth rates for the Nasdaq-100 Index® (NDX®) and the S&P 500 are on track for approximately 15.9% and 13.1%, respectively. But small margins for error, elevated valuations, AI capex questions, and shifts in market pricing of the Federal Reserve’s benchmark rate have left equities sensitive to downdrafts in the near-term. However, it is always important to take a step back from the daily noise: 1) intra-year drawdowns of -5% to -10% are very frequent and 2) U.S. equities have been positive in 35 of the 45 years since 1980.
The economic and market splits are also evident on a micro scale, per the Fed’s latest bank survey and relative equity performance of large versus small banks. The Fed has found itself in a precarious position as rate cuts are needed to benefit the more rate-sensitive consumers and companies. But recent Fed speak has been hawkish due to inflationary concerns and as its outlook has become clouded in the interim due to the government data vacuum. This lack of clarity has been priced into the markets recently as well—resulting in a market full of divergences.
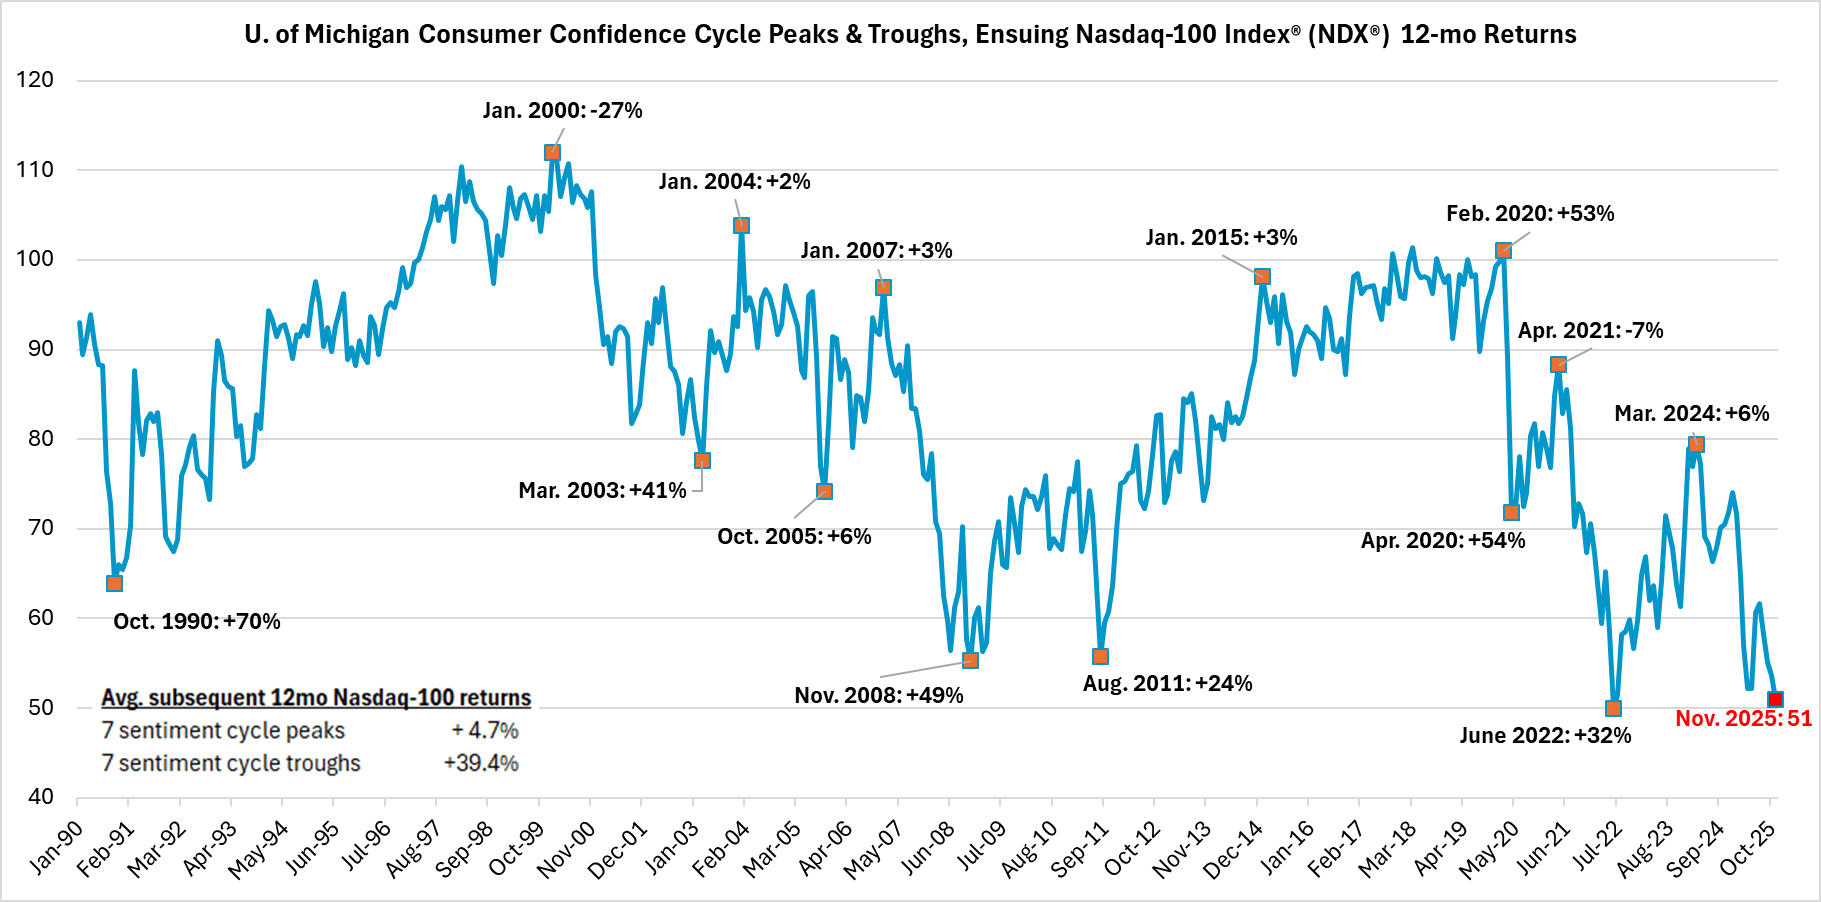
Biweekly Chart in Focus: Equities average a 39% return 1-year after consumer confidence cycle troughs. But confidence has never been this low around equity highs
Source: Bloomberg, J.P. Morgan Asset Management
Details
A K-shaped U.S. consumer
Our Biweekly Chart in Focus above shows an intriguing bifurcation between the current economic and market environments: U.S. consumer confidence hit its second lowest on record in the preliminary November 2025 reading (data begins in January 1978), yet equities are still within 5% of their all-time highs. Appreciating that this University of Michigan sentiment indicator was likely negatively impacted by the temporary government shutdown and changes to sampling, it is still informative that consumer confidence has never been at a sentiment cycle trough while equities hovered near their highs.
A two-tiered U.S. economy is not a new phenomenon. The discussion has just become more prevalent given the K-shaped economy amidst weakening employment trends which could impact what has been resilient consumer spending (more on this below). These trends stand to be further reinforced once delayed government data begins to be released. In the absence of government data, the markets have looked to alternative data sources. Challenger reported 153,000 layoffs announced in October—the most in an October since 2003. ADP's new weekly private payrolls report showed 45k job losses in the four weeks ending October 25th.
The weaker labor market has increased the pressure on the Fed to cut rates in an effort to better support the lower income cohort. However, recent commentary from FOMC members has been hawkish with a focus on inflation and given the gap in economic data, divergences have widened amongst the FOMC as well. This leaves Fed Funds futures pricing in around a 50% probability of a rate cut at the December 10th meeting, down from 70% in early November.
The more financially vulnerable segment of the population is in greater need of relief on rates which are directly impacted by the Fed Funds rate, such as credit cards and auto loans. As a proxy, the share of subprime borrowers at least 60 days past due on their auto loans rose to 6.65% in October—the highest in data going back to 1994 per Fitch Ratings.
This is juxtaposed by the wealthier share of the population which has generally benefited from the wealth effect of higher equity prices. J.P. Morgan Chase estimates that the gains from the top 30 AI stocks account for about 16% of the increase in consumer spending over the past year. This has been key for the resiliency of the U.S. consumer overall given the top 10% of earners account for nearly 50% of consumer spending.
The benefit from equities’ appreciation driven by the AI trade is likely reflected in both qualitative and quantitative consumer metrics, such as:
- The difference in Conference Board Consumer Confidence index for those making more than $125,000 and those making between $50,000 and $75,000 is the widest since July 2023. (The top 10% income threshold is $148,812 per the Social Security Administration and the U.S. individual median income is $50,960 per the Census Bureau.)
- The wealthiest 10% (total net worth of more than $2 million) own 87% of U.S. corporate equities and mutual funds, per the Federal Reserve. Figure 2 below shows the spread versus the ownership of the remaining 90% has reaccelerated over the past few years and has risen materially since the early 2000s.
Figure 2: Spread between top 10% of wealthiest Americans’ ownership of corporate equities & mutual funds vs. remaining 90%

Source: Federal Reserve
Corporate earnings read-throughs
Given the known concentration in the AI secular trend within U.S. equities, if looking through the wealth effect lens, one risk is that a notable downturn could impact consumer spending. J.P. Morgan estimates that the more than $5 trillion added to household wealth “will raise their annualized level of spending by about $180 billion, or 0.9% of total consumption.”
While equities have stalled out recently around valuation concerns, a clouded Fed rate outlook which impacts the more growth-oriented equities/AI ecosystem, and a high bar for earnings expectations which can make equities more susceptible to short-term pullbacks, earnings have remained supportive (see our November 7th report and the latest Nasdaq-100 Weekly for more details). The driver behind the S&P 500’s blended Q3 year-over-year growth rate of 13.1% continues to be the Technology sector. Per FactSet, along with reporting the highest earnings growth rate (27.3%), all six tech industries are reporting double-digit earnings growth—led by the semiconductor industry at 49%.
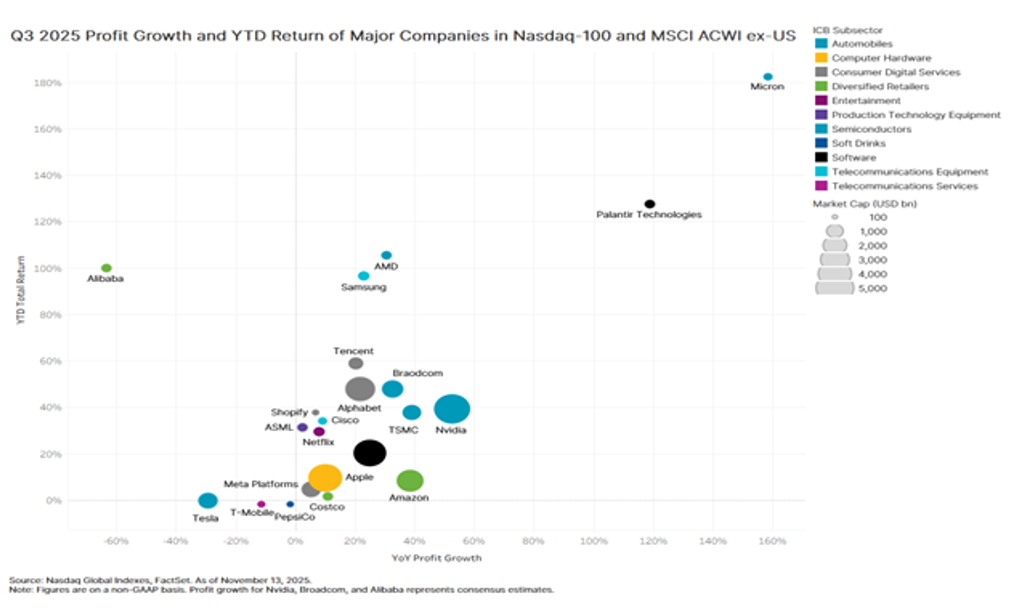
FactSet notes that despite ongoing tariff concerns and higher input costs, the blended net profit margin for the S&P 500 for Q3 is also 13.1%—the highest going back to at least 2009—illustrating the efficiency and operational prowess of corporate America. Figure 3 shows how strong fundamentals such as profit growth have mostly correlated with higher equity performance in 2025.
Figure 3: Q3 2025 profit growth vs. YTD returns tend to correlate
The margin for error is small in the very near-term against the backdrop of elevated valuations and the recent uncertainties around the Fed rate path trajectory. The iShares MSCI U.S. Momentum Factor ETF (MTUM) had its worst 2-day return on November 13th since mid-April (-2.4%). Many of the largest weights in MTUM are higher growth stocks which can benefit from lower interest rates as they factor into valuation models. A reduction in Fed rate cut expectations, in turn, can exacerbate their adverse reactions.
Figure 4 also speaks to this dynamic as those companies which had a negative earnings surprise in Q3 were punished more while those which had positive earnings surprise were rewarded by less relative to the respective 5-year averages.
Figure 4: S&P 500 Q3 price reaction 2-days prior through 2-days after earnings release

Source: FactSet
For investors, though, unless a fundamental thesis has shifted, it is likely best to stay the course and look through near-term volatility. Pullbacks of -5% to -10% are normal and, since 1980, there has only been one instance of a -5% to -10% intra-year decline when U.S. equities have not finished the year positive (1994 during the “Great Bond Massacre”). We are not conveying something ground-breaking, but a reminder is always useful: equities have finished the year higher 78% of the time going back to 1980 (Figure 5).
Figure 5: Despite average intra-year drops of -14.1% (in red below), annual S&P 500 returns are positive 78% of the time since 1980

Source: J.P. Morgan Asset Management
Micro divergence: large vs. small banks
The prior two sections spoke to those who have and have not been beneficiaries of the AI theme from a macro/economic perspective and YTD equity market returns. Yet it is also important to focus on micro developments for a complete mosaic.
Largely overlooked in the top-down headlines was an important bottom-up indicator: the latest Fed Senior Loan Officer Opinion Survey (SLOOS) which discusses “changes in the standards and terms on, and demand for, bank loans to businesses and households over the past three months” (i.e., Q3 2025).
The latest SLOOS is also illustrative of a K-shaped dynamic. A net 6.5% of banks reported tighter lending standards for Commercial and Industrial (C&I) loans to large- and mid-sized firms. This is down from 18.5% in April during peak trade tariff concerns, though still higher than a net 0% reporting tighter lending standards a year ago. However, a net 8.3% of banks say they've tightened standards for smaller companies—a tick up from July's survey, but the drop from April’s 15.9% level is less pronounced than declines seen for large- and mid-sized companies.
Under the notion that large banks tend to lend to large firms and small banks tend to lend to small firms (Mkhaiber, Werner. Journal of International Money and Finance (2021)), the loosening in lending standards for C&I loans to large- and mid-sized companies tracks with the KBW Nasdaq Bank Index™ (BKX™) in Figure 6. This index of larger money center and regional banks recently hit new highs, is up 40% from the April 8th lows, and has outperformed the S&P 500 by nearly 7% since then (Figure 7).
As another example of the K-shaped trend in the economy and the markets, the Russell 2000 Index of smaller banks has underperformed since the April 8th lows. It is more sensitive to the domestic economy with less levers on which to pull versus larger banks (underperforming by around 24% since the lows) and can be more interest rate sensitive, amongst other factors (Figure 7). Accounting for 44% of U.S. workers per ADP, small businesses (1-49 employees) remain the largest employer as a share of the workforce.
For a more balanced U.S. economy, the small-to-mid size (mid account for 38% of U.S. employees) businesses, along with the aforementioned lower income and wealth cohorts, will need to be supported. Despite two sequential rate cuts, the Fed has more dry powder to support these key segments of the economy. Yet its outlook has quickly become clouded due to the lack of visibility from the government shutdown coupled with resurfacing inflation concerns.
Figure 6: Improving C&I lending standards for large- & mid-sized firms has tracked with KBW Nasdaq Banks Index
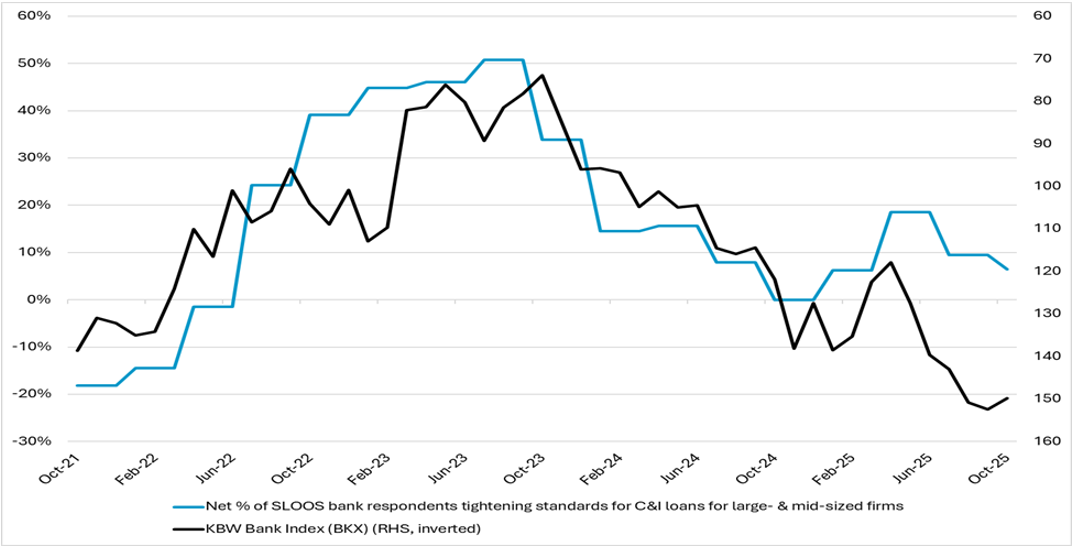
Source: Bloomberg, Federal Reserve
Figure 7: Larger banks have notably outperformed since the April 8th lows

Source: Bloomberg
Disclaimer:
Nasdaq® is a registered trademark of Nasdaq, Inc. The information contained above is provided for informational and educational purposes only, and nothing contained herein should be construed as investment advice, either on behalf of a particular security or an overall investment strategy. Neither Nasdaq, Inc. nor any of its affiliates makes any recommendation to buy or sell any security or any representation about the financial condition of any company. Statements regarding Nasdaq-listed companies or Nasdaq proprietary indexes are not guarantees of future performance. Actual results may differ materially from those expressed or implied. Past performance is not indicative of future results. Investors should undertake their own due diligence and carefully evaluate companies before investing. ADVICE FROM A SECURITIES PROFESSIONAL IS STRONGLY ADVISED.
© 2025. Nasdaq, Inc. All Rights Reserved.
Latest articles

This data feed is not available at this time.
Data is currently not available