

Navigating a market of solid fundamentals amidst elevated valuations & all-time highs
- U.S. equity valuations remain very elevated relative to their history & on an absolute basis. But valuations are historically a better predictor of returns over the longer-term.
- FOMC cut rates as expected, though there were mixed signals as the Federal Reserve wrestles with a “K-shaped” economy & a data vacuum given the government shutdown.
- Earnings & fundamentals will ultimately determine whether these elevated valuations can be supported as a strong Q3 earnings season continues.
Summary
There is no shortage of sound reasons to remain risk-on despite U.S. equities having recently hit new highs (again), including: a solid U.S. earnings backdrop driven by the AI secular theme, the Fed easing into already accommodative financials conditions (cut by another 25 basis points last week, but other factors were at play as well), a resilient U.S. economy, a respite on the U.S-China trade front, the U.S. tax cut legislation, a deregulatory environment, corporate buybacks, strong retail flows, and favorable seasonality.
Conversely, the case for giving pause at this point is also credible, such as: elevated valuations pulled forward by the expectations that voracious AI spending will translate into a step-up in revenues and profits, a very concentrated/narrow U.S. equity market leaving little room for error and a high bar for earnings, a still uncertain trade tariff outlook, a weakening labor market, elevated stock-bond return correlations over the past five years making it challenging for total portfolios, market complacency, concerns over U.S. fiscal policies and runaway federal debt loads, and questions around the Fed’s independence.
As we’ve previously laid out, attempting to time the market is a challenging endeavor. Instead, we leverage the holistic insights from Nasdaq thought leaders encompassing fundamental, macro, technical, and quantitative analyses for a medium-term outlook in an effort to explore broader opportunity sets.
The notion that investors should dial back risk solely based on elevated valuations can be myopic given the markets do not operate in a vacuum. Of course, valuations are an important piece of a holistic investment process. But they are not generally viewed as a good timing tool in the short-term; they are historically a better predictor of future returns as time goes on. And against the backdrop of new all-time highs for equity indices, is it better to buy at these levels or on other days? History shows that over the longer-term, there is not much of a difference.
Biweekly Charts in Focus: Historical relationship between P/E ratios & forward equity returns are stronger over time
Nasdaq-100 Index® (NDX®) NTM P/E vs. subsequent 1-year forward returns
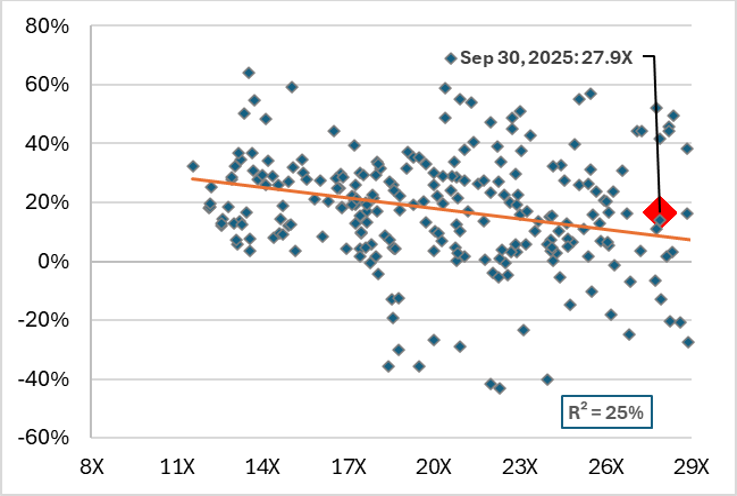
Source: Nasdaq Index Research, FactSet. Notes: monthly intervals beginning in December 2000.
Nasdaq-100® NTM P/E vs. subsequent 5-yr annualized forward returns
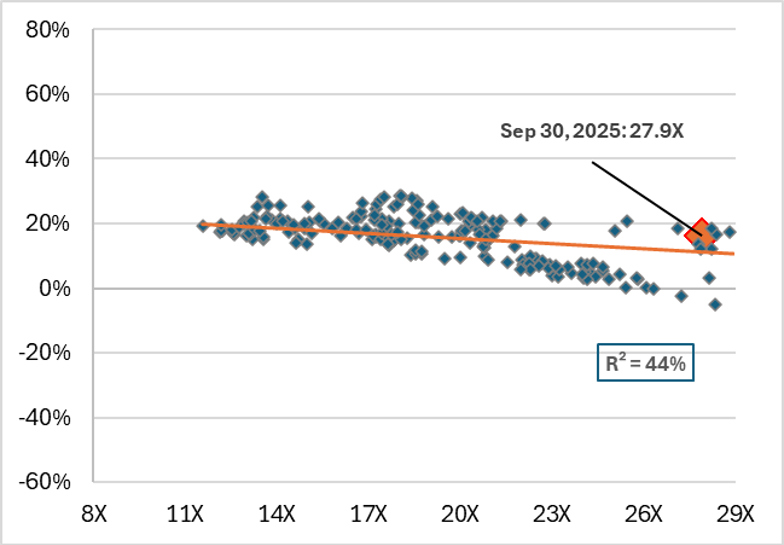
Source: Nasdaq Index Research, FactSet. Notes: monthly intervals beginning in December 2000.
Details
Wrestling with extreme valuations & all-time highs
There is no denying that U.S. large-cap equities’ forward P/Es are elevated relative to their own history, other U.S. market cap universes, and international markets (Figure 2). They are also at extreme levels across other valuation metrics relative to their history (Figure 3).
But do elevated valuations portend for weaker forward equity price returns in the short-term? Not necessarily. The above Biweekly Charts in Focus (courtesy of Nasdaq Index Research) illustrate the historical relationship between the forward P/Es of the Nasdaq-100 and the subsequent 1- and 5-year price returns. The point is that starting valuations tend to have a greater predictive power over five years versus shorter, one-year periods.
Figure 2: Current NTM P/Es vs. 20-Year Distribution
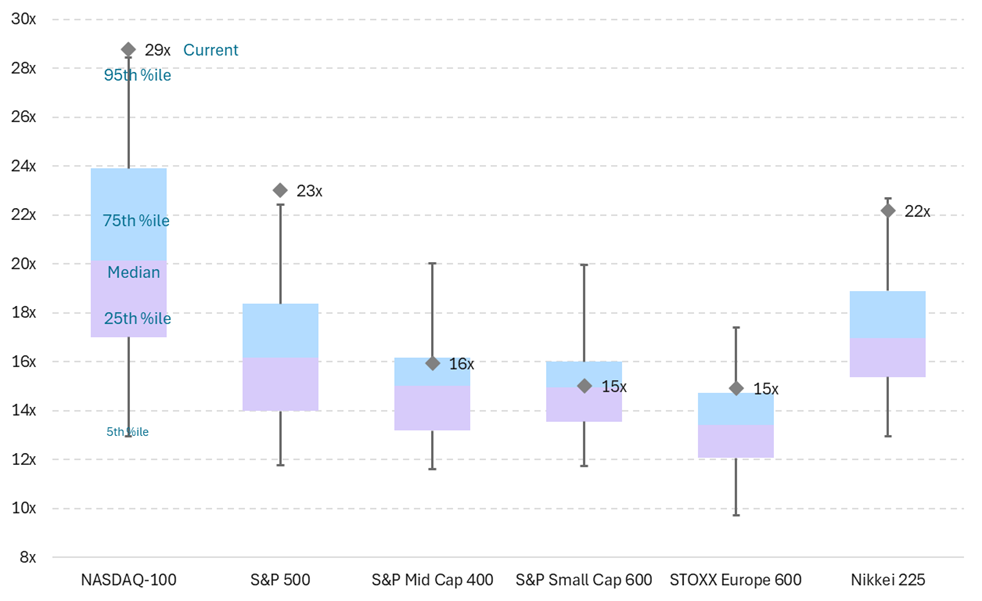
Source: FactSet. Notes: as of October 30, 2025.
Figure 3: S&P 500 Valuation Current Percentile vs. 20-Year Distribution
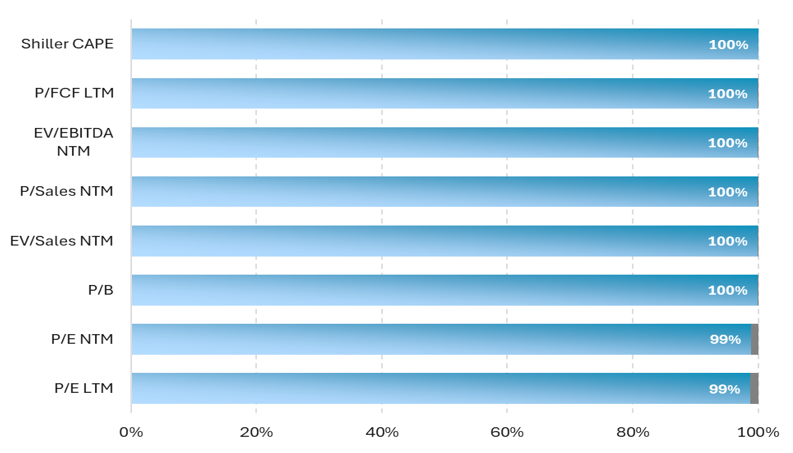
Source: FactSet. Notes: as of October 30, 2025.
The prospects of returns from investing in the secular AI theme has been a key tenet for U.S. equities continuing to set new all-time highs and have led to a pull-forward effect for valuations. For investors’ psychology, it can understandably be difficult to balance the thought of adding further risk when valuations are at such elevated levels while equities continue to hit new levels.
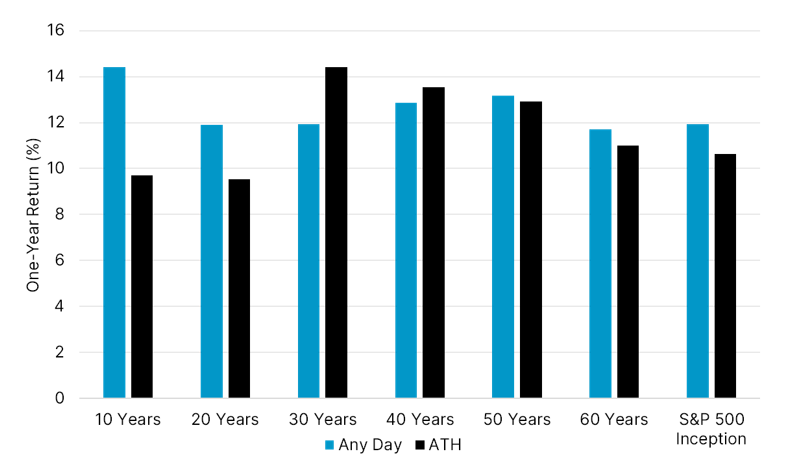
Selling simply because equities are at an all-time high is also not necessarily a consistent predictor of 1-year forward returns. As our friends at Nasdaq Dorsey Wright show via Figure 4, buying U.S. equities on an average day over the past 10 and 20 years has produced stronger returns versus buying at the highs. However, buying at the highs over the past 30 to 60 years has either resulted in higher returns over the ensuing year or slightly lower returns. Historically, buying on an average day has shown a return of almost 12% over the ensuing year, compared to buying at the highs, which has shown a return of around 10.6% over the same period—a minimal difference over the longer-term. (It's important to note that these are averages and past performance does not guarantee future results.) As Tony DeSpirito, BlackRock’s Global CIO of Fundamental Equities has deftly phrased it: “It’s about time in the market, not timing the market.”
Figure 4: S&P 500 forward performance at all-time highs (ATH) vs. average day
Source: Nasdaq Dorsey Wright
FOMC recap
The Fed easing into already accommodative financial conditions has also been a tailwind for risk assets. The FOMC cut its benchmark rate by another 25 basis points to 3.75% to 4% on October 29th. They also announced that their Quantitative Tightening (QT) program will end on December 1st to stop shrinking the Fed’s balance sheet in response to an increase in funding pressures over the last few weeks. This comes amidst a steady U.S. economic backdrop—albeit one with a weakening labor market and inflation which “has moved up since earlier in the year and remains somewhat elevated”, per the latest FOMC statement.
Two other key observations from last week’s meeting: 1) markets were caught offsides during Fed Chair Powell’s press conference when he played down the notion that another 25 basis point cut is a given at the December 10th meeting (market pricing fell from a 92% change of a rate cut heading into the meeting to around 62% today), and 2) there were notable dissents amongst the FOMC from both the doves and the hawks.
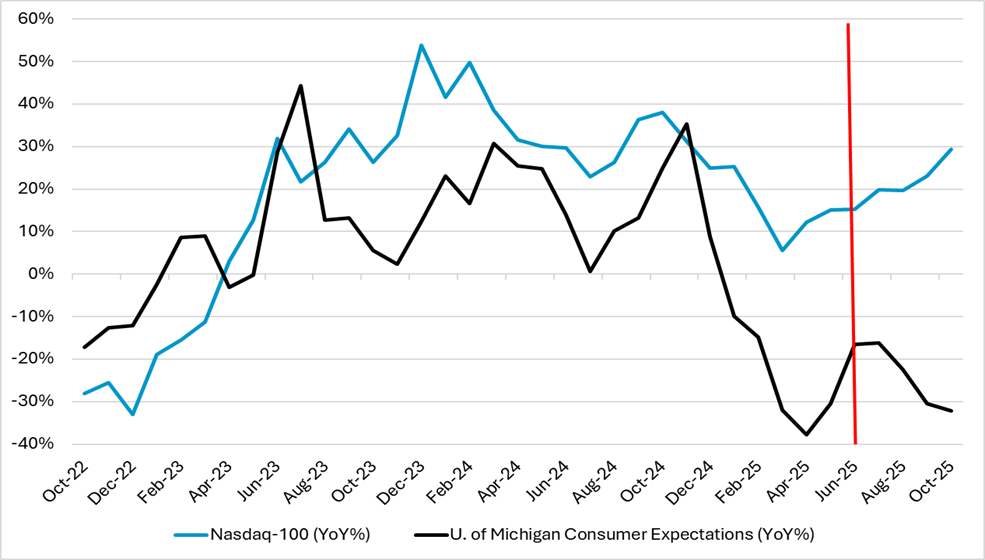
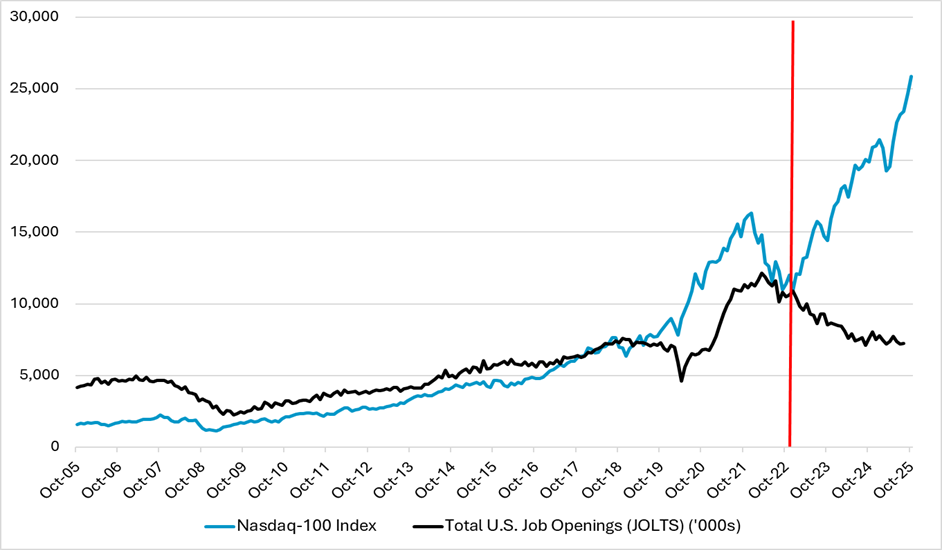
As discussed in our September 12th piece, there is the real economy and then there is the market economy. Figure 5 speaks to the “K-shaped” U.S. economy which shows the annual changes in two forward looking indicators: consumer confidence expectations and equities. Those with equity-heavy balance sheets have generally benefited as returns have accelerated since mid-2025. However, there is a disconnect with consumer confidence expectations falling amidst concerns around weaker labor markets, the varying impacts from the ongoing U.S. government shutdown (now the longest on record), and broader uncertainties for consumers (e.g., impacts from trade tariffs). Figure 6 is an example of the K-shaped economy developing over the longer-term: the Nasdaq-100 versus total U.S. job openings. These are dynamics which the Fed continues to watch, but is “flying blind” given the dearth of data due to the government shutdown.
Figure 5: “K-shaped” U.S. economy (I)
Source: Bloomberg.
Figure 6: “K-shaped” U.S. economy (II)
Source: Bloomberg.
A solid Q3 earnings season
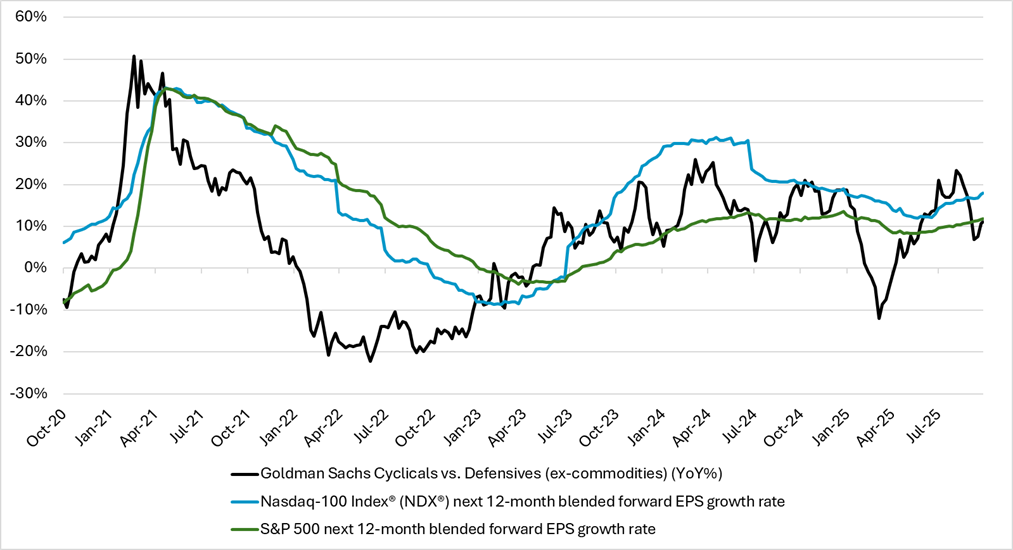
Valuations are a byproduct of the earnings and fundamental outlook for a company or an index—and thus far the solid earnings backdrop has helped to justify these elevated valuations. Per Figure 7, the forward EPS growth rate for U.S. equities has continued to drift higher post the peak trade tariff concerns earlier this year. The markets—as is their job—had priced in this improvement, specifically when looking at a proxy of U.S. cyclicals relative to defensives.
Figure 7: Cyclicals outperforming defensives since May 2025 speaks to accelerating EPS growth rates
Source: Bloomberg
With 61% of the Nasdaq-100 and 68% of the S&P 500 market caps having reported as of October 31st, it has been another strong earnings season thus far.
- Nasdaq-100 EPS is on track for 12% YoY growth versus expectations of 9% YoY. This would be the tenth consecutive quarter of positive double digit EPS growth.
- 76% of companies in the Nasdaq-100 reporting beat EPS estimates.
- 87% of companies in the Nasdaq-100 reporting have beaten revenue estimates.
- See the latest Nasdaq-100 Weekly for more details on Q3 earnings.
- Per FactSet, S&P 500 EPS is on track for 10.7% YoY growth versus expectations of 7.9% YoY. This would mark the fourth consecutive quarter of double-digit EPS growth.
- 83% of S&P 500 companies have reported a positive EPS surprise—above both the 5-year average of 78% and the 10-year average of 75%. This would mark the largest share of companies reporting a positive EPS surprise since Q2 2021.
- 79% of S&P 500 companies reporting have beaten revenue estimates—above both the 5-year average of 70% and the 10-year average of 66%.
For the directionality of equities into year’s end, earnings and fundamental outlooks will likely continue to be the drivers. As cited in prior pieces, U.S. corporates remain the best-in-class, globally. This has translated into earnings growth being a key driver for overall equity returns as shown in Figure 8. It will also be about translating these massive AI investments into potential revenues and productivity gains, which could positively influence earnings prospects. The markets, though, will need to further explore the opportunity set beyond the mega-cap tech space and AI hyperscalers within the U.S. Investors will also be served diversifying internationally for broader themes as well as idiosyncratic opportunities.
Figure 8: Index Price Returns & 12-month Forward Earnings Changes vs. 2024
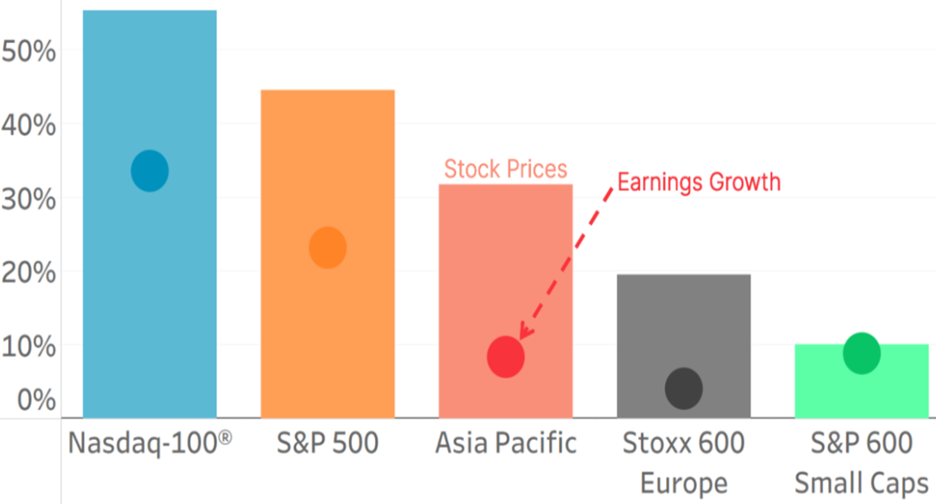
Source: Nasdaq Economic Research, FactSet. Notes: as of October 30, 2025.
Disclaimer:
Nasdaq®, Nasdaq-100®, and Nasdaq Stock Market® are registered trademarks of Nasdaq, Inc. The information contained above is provided for informational and educational purposes only, and nothing contained herein should be construed as investment advice, either on behalf of a particular security or an overall investment strategy. Neither Nasdaq, Inc. nor any of its affiliates makes any recommendation to buy or sell any security or any representation about the financial condition of any company. Statements regarding Nasdaq-listed companies or Nasdaq proprietary indexes are not guarantees of future performance. Actual results may differ materially from those expressed or implied. Past performance is not indicative of future results. Investors should undertake their own due diligence and carefully evaluate companies before investing.
ADVICE FROM A SECURITIES PROFESSIONAL IS STRONGLY ADVISED.
© 2025. Nasdaq, Inc. All Rights Reserved.
Latest articles

This data feed is not available at this time.
Data is currently not available