

Executive summary:
- S&P 500 and Nasdaq extend multi-month winning streaks, setting fresh record highs
- The Federal Reserve is likely to cut the fed funds rate by 25bps in September
- 81% of S&P 500 companies beat EPS and revenue estimates
- Developments out of Washington continue to dominate headlines
Index performance for August:

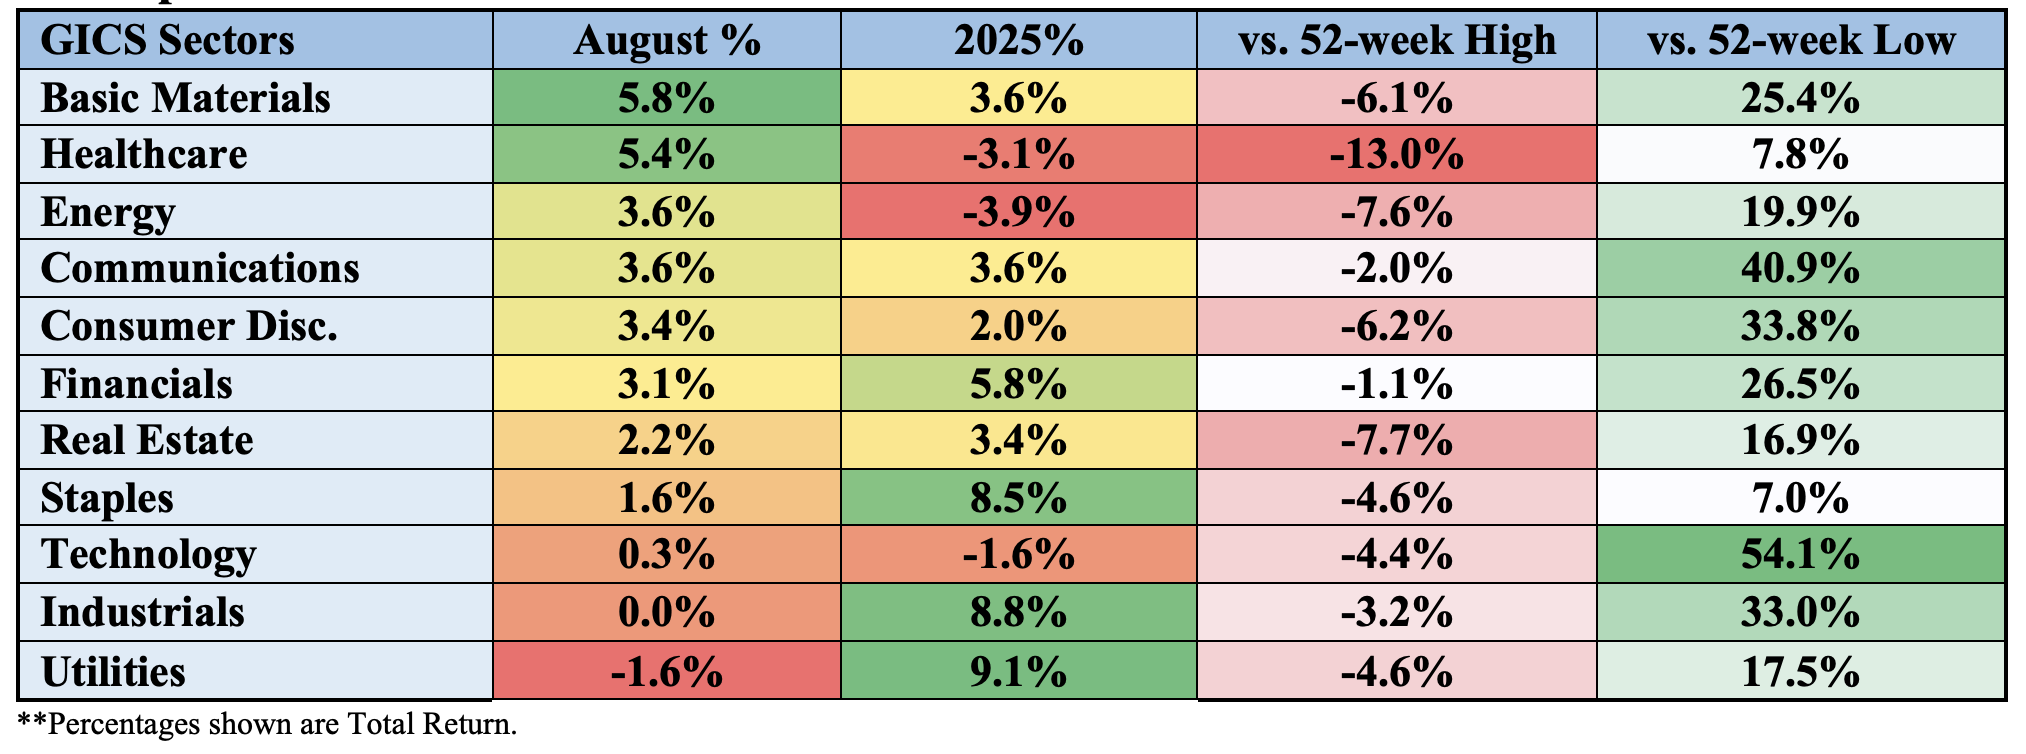
U.S. equities posted another strong month in August, with the S&P 500 and Nasdaq extending multi-month winning streaks and setting fresh record highs. The Russell 2000 surged +7.00%, its best performance since November 2024, signaling renewed strength in small-cap stocks. Market breadth improved, with the equal-weight S&P outperforming its cap-weighted counterpart. Sector leaders included materials, healthcare and communication services, while utilities and industrials underperformed and tech was mixed. Treasuries firmed as the yield curve steepened, gold broke above $3,500/oz, and crude oil fell amid geopolitical volatility.
August’s rally was fueled by dovish signals from the Fed following a weak July jobs report and downward revisions to prior months. Fed officials, including Governor Waller and Chair Powell, emphasized growing labor market softness and limited inflation pressures, boosting expectations for multiple rate cuts in 2025. Trade policy remained a key theme, with Trump reinstating tariffs on several countries while delaying action on China. Despite headline risks, exemptions and bilateral deals helped ease uncertainty. Q2 earnings season was robust, with S&P 500 EPS growth nearing 12% year-over-year—well above initial forecasts. Consumer spending remained resilient, though signs of trading down emerged.
Corporate news from big tech and healthcare names added to the bullish tone. The move to fire Fed Governor Cook over alleged mortgage fraud stirred debate about Fed independence but had limited market impact. Overall, August’s gains were supported by strong earnings, resilient consumer behavior, dovish Fed commentary and improving market breadth. However, risks remain as we enter September, including unresolved trade tensions, potential consumer strain and questions around the ROI of AI-driven capital expenditures.
Key Economic Data Trends in August 2025:
Labor Market
- Nonfarm payrolls increased by 73k, well below the expected 105k and prior 147k, signaling a slowdown in job creation.
- Private payrolls rose by 83k, while manufacturing payrolls declined by 11k, reflecting sector-specific weakness.
- The unemployment rate held steady at 4.2%, but underemployment rose to 7.9%, suggesting broader labor market slack.
- Average hourly earnings grew 0.3% MoM and 3.9% YoY, indicating steady wage growth.
- Labor force participation rate slightly decreased to 62.2%.
Inflation
- Consumer Price Index (CPI) rose 0.2% MoM and 2.7% YoY, while Core CPI (excluding food and energy) increased 3.1% YoY, indicating moderate but persistent inflation.
- Producer Price Index (PPI) surged 0.9% MoM and 3.3% YoY, with Core PPI (excluding food and energy) up 3.7% YoY, reflecting stronger upstream price pressures. •
- Personal Consumption Expenditures (PCE) Price Index rose 0.2% MoM and 2.6% YoY in July.
- Core PCE Price Index increased 0.3% MoM and 2.9% YoY, showing persistent underlying inflation.
Consumer Sentiment
- University of Michigan sentiment index fell to 58.2 in August from 61.7 in July signaling weakening consumer confidence.
- Current conditions dropped to 61.7 and expectations declined to 55.9, pointing to growing economic uncertainty.
Housing
- Housing starts jumped to 1.428 million, beating expectations and prior values.
- Building permits came in at 1.354 million, slightly below expectations, suggesting potential future moderation.
Manufacturing & Services
- S&P Global US Manufacturing PMI rose to 53.3, indicating expansion in factory activity.
- Services PMI increased to 55.4, reflecting strong momentum in the service sector.
GDP
- Q2 GDP growth was revised up to 3.3% annualized, showing robust economic expansion.
- Personal consumption remained steady at 1.6%, supporting growth.
- Core PCE Price Index remained at 2.5% QoQ, consistent with the Fed’s inflation target.
Sector performance:
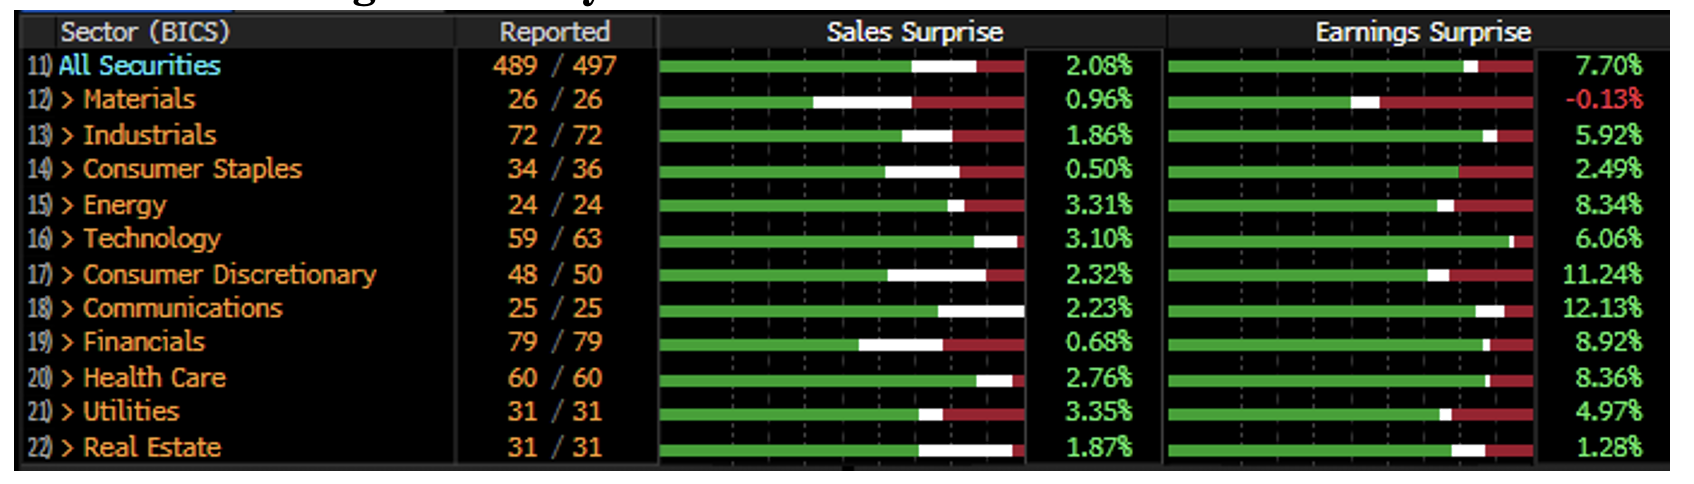
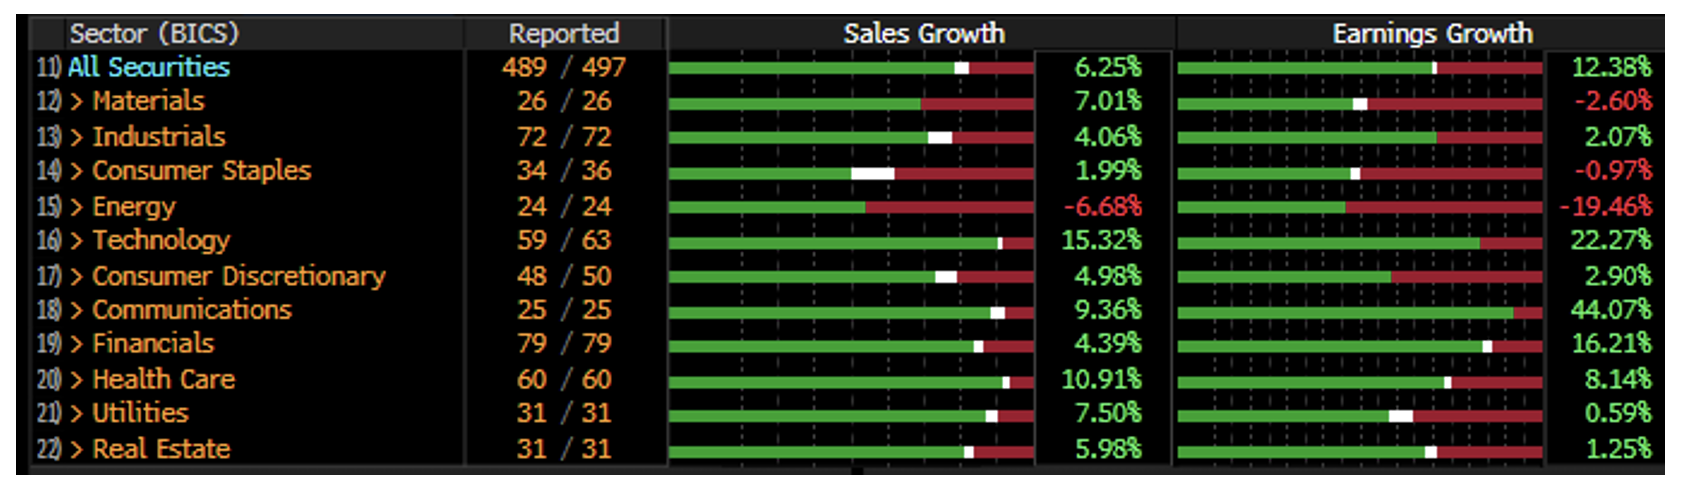
Earnings commentary (source FactSet):
The Q2 2025 earnings season showed strong performance across the S&P 500, with 81% of companies beating EPS and revenue estimates, both above their 5- and 10-year averages. According to FactSet data, the blended earnings growth rate reached 11.9%, up from 4.8% at the start of the quarter, marking the third consecutive quarter of double-digit earnings growth. Revenue growth came in at 6.4%, also above historical averages. Key sectors driving this strength included Communication Services, Information Technology, Financials, and Consumer Discretionary. However, the Energy and Materials sectors lagged, reporting year-over-year declines in both earnings and revenues due to lower oil prices and weaker performance.
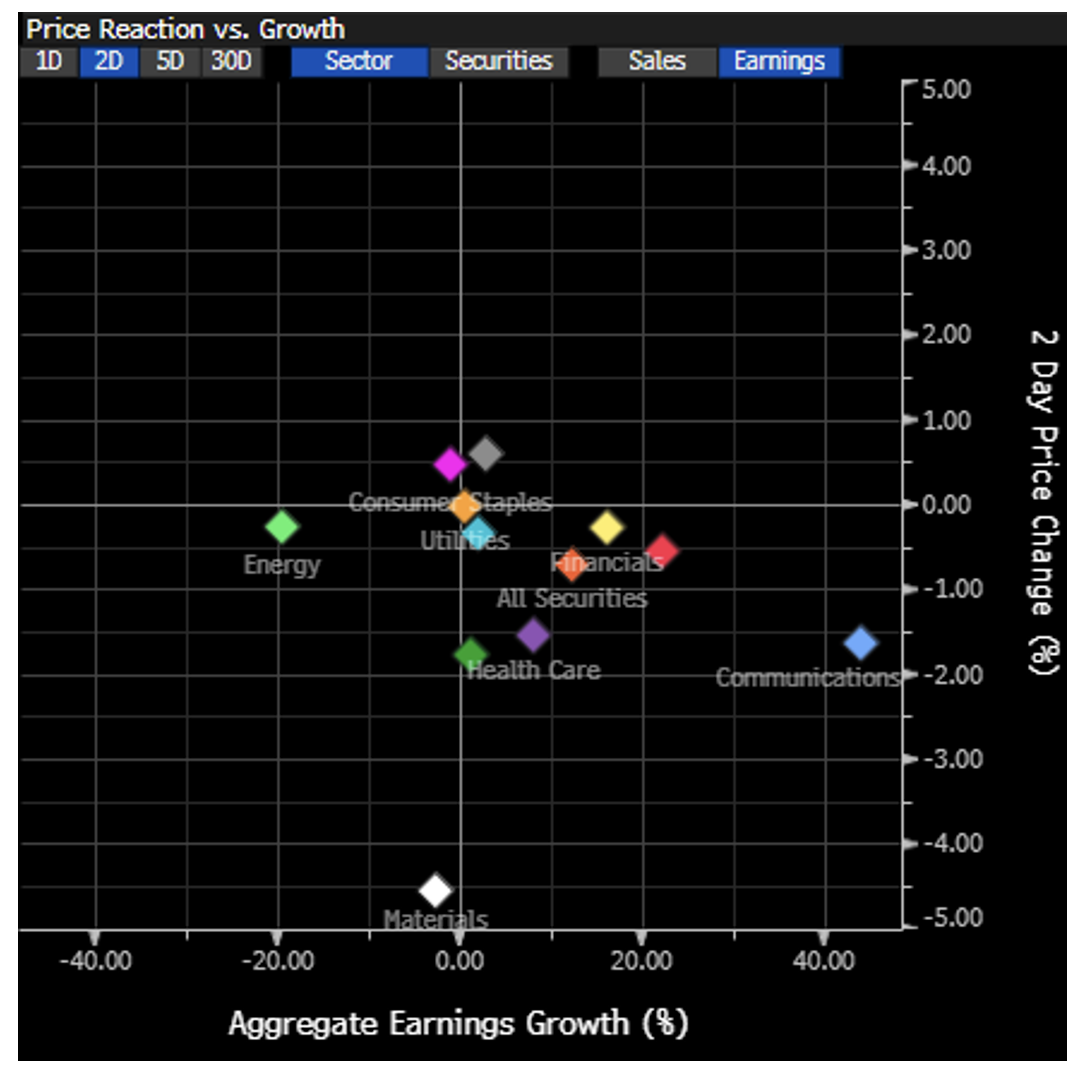
Looking ahead, analysts project moderate earnings growth for the S&P 500: 7.5% in Q3, 7.2% in Q4, and 10.6% for CY 2025, with 13.4% expected in CY 2026. The forward 12-month P/E ratio stands at 22.4, above both the 5- and 10-year averages, indicating elevated valuations. Despite strong results, the market has punished negative EPS surprises more severely than usual, with affected stocks dropping an average of -5.5%, compared to the 5-year average of -2.4%. Meanwhile, positive surprises led to only modest gains of +0.4%, below the typical +1.0%.
Sales and earnings results by S&P sector:
Source: Bloomberg L.P.
Source: Bloomberg L.P.
2-day price reaction following earnings releases:
Source: Bloomberg L.P.
Fed Fund Futures are pricing in a ~92% chance of a cut at the September meeting:
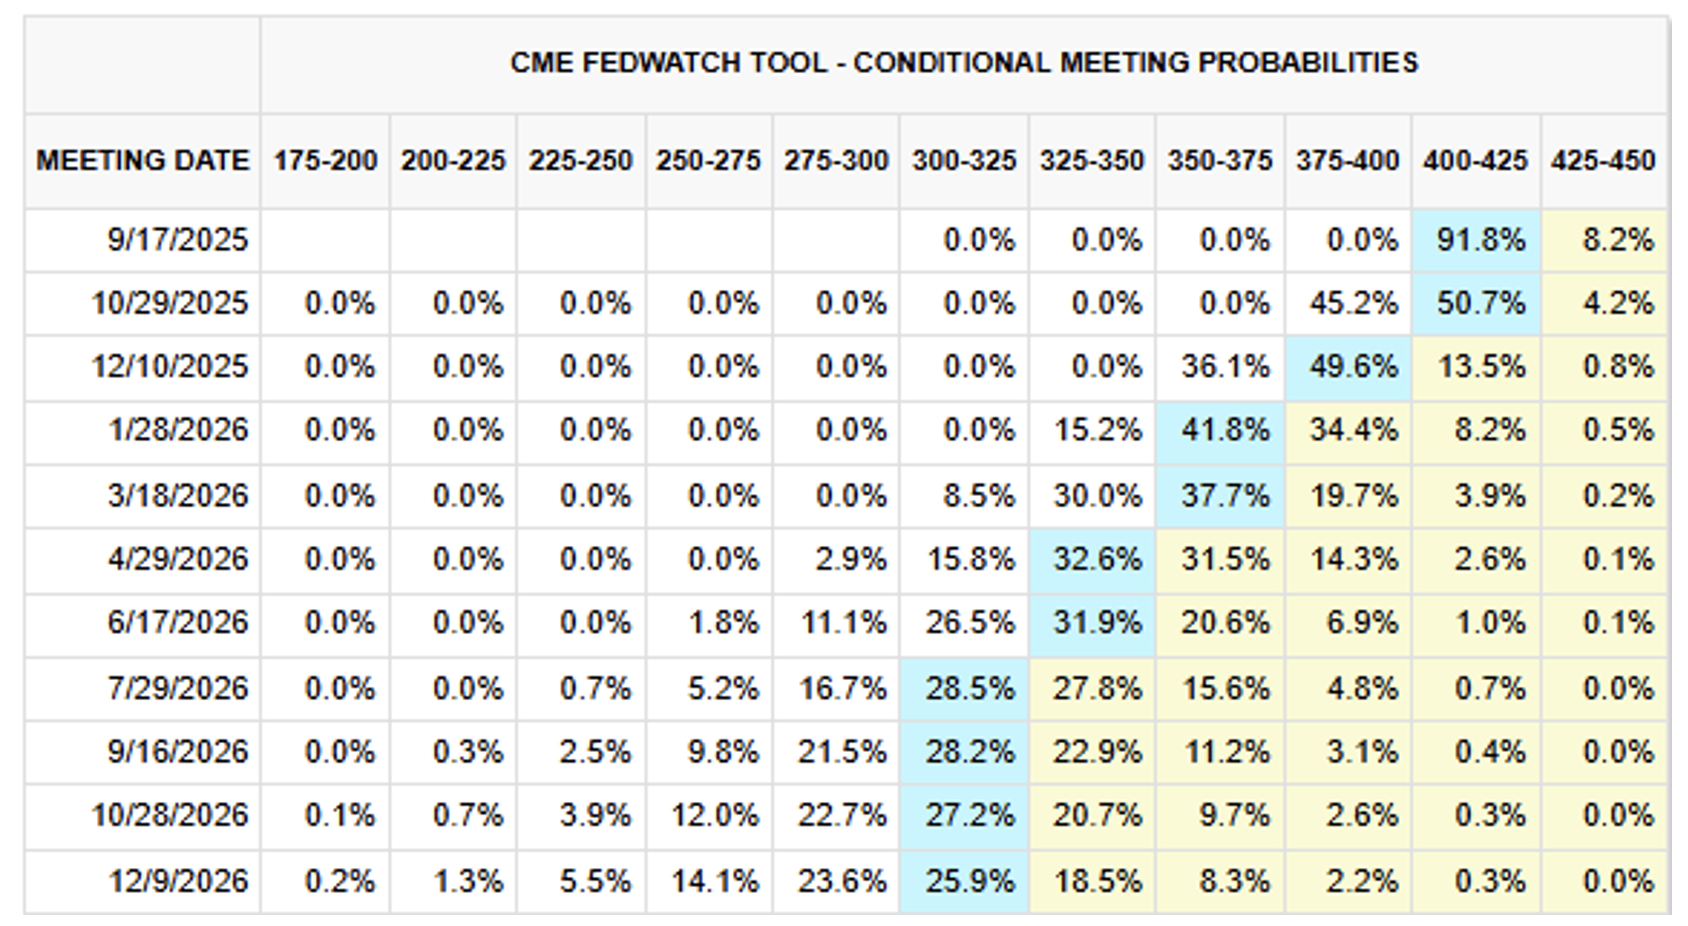
Source: CME Fedwatch
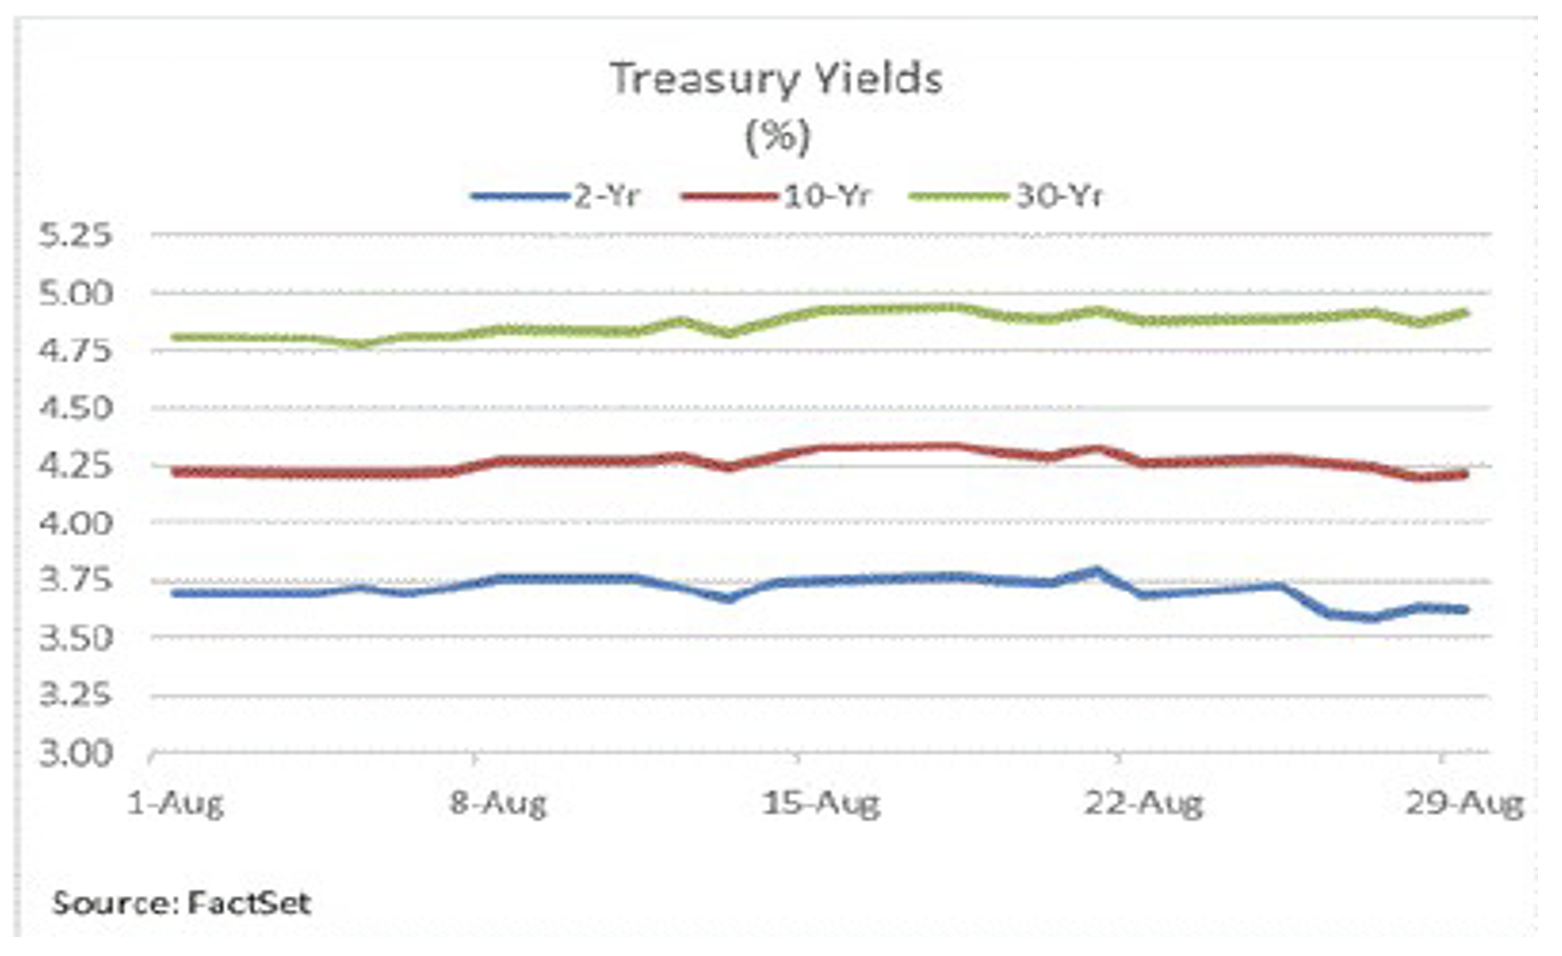
Treasury yields in August:
10-Year Treasury Constant Maturity Minus 2-Year Treasury Constant Maturity:
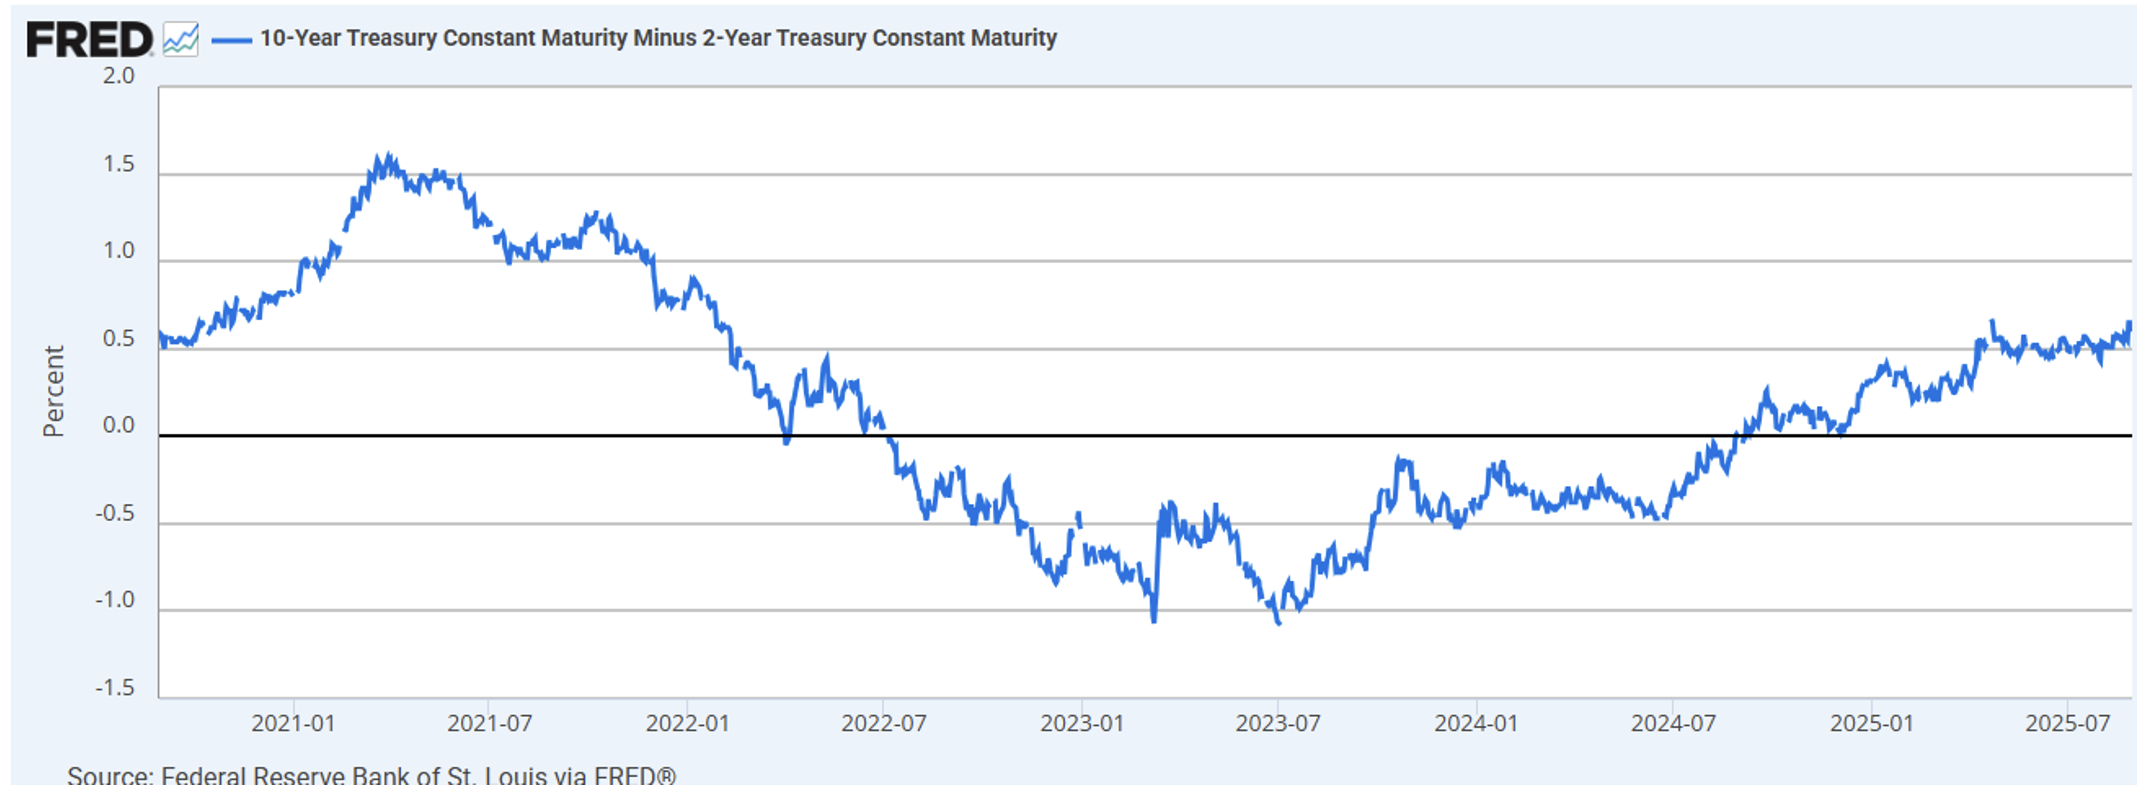
Source: Federal Reserve FRED data
Gold:
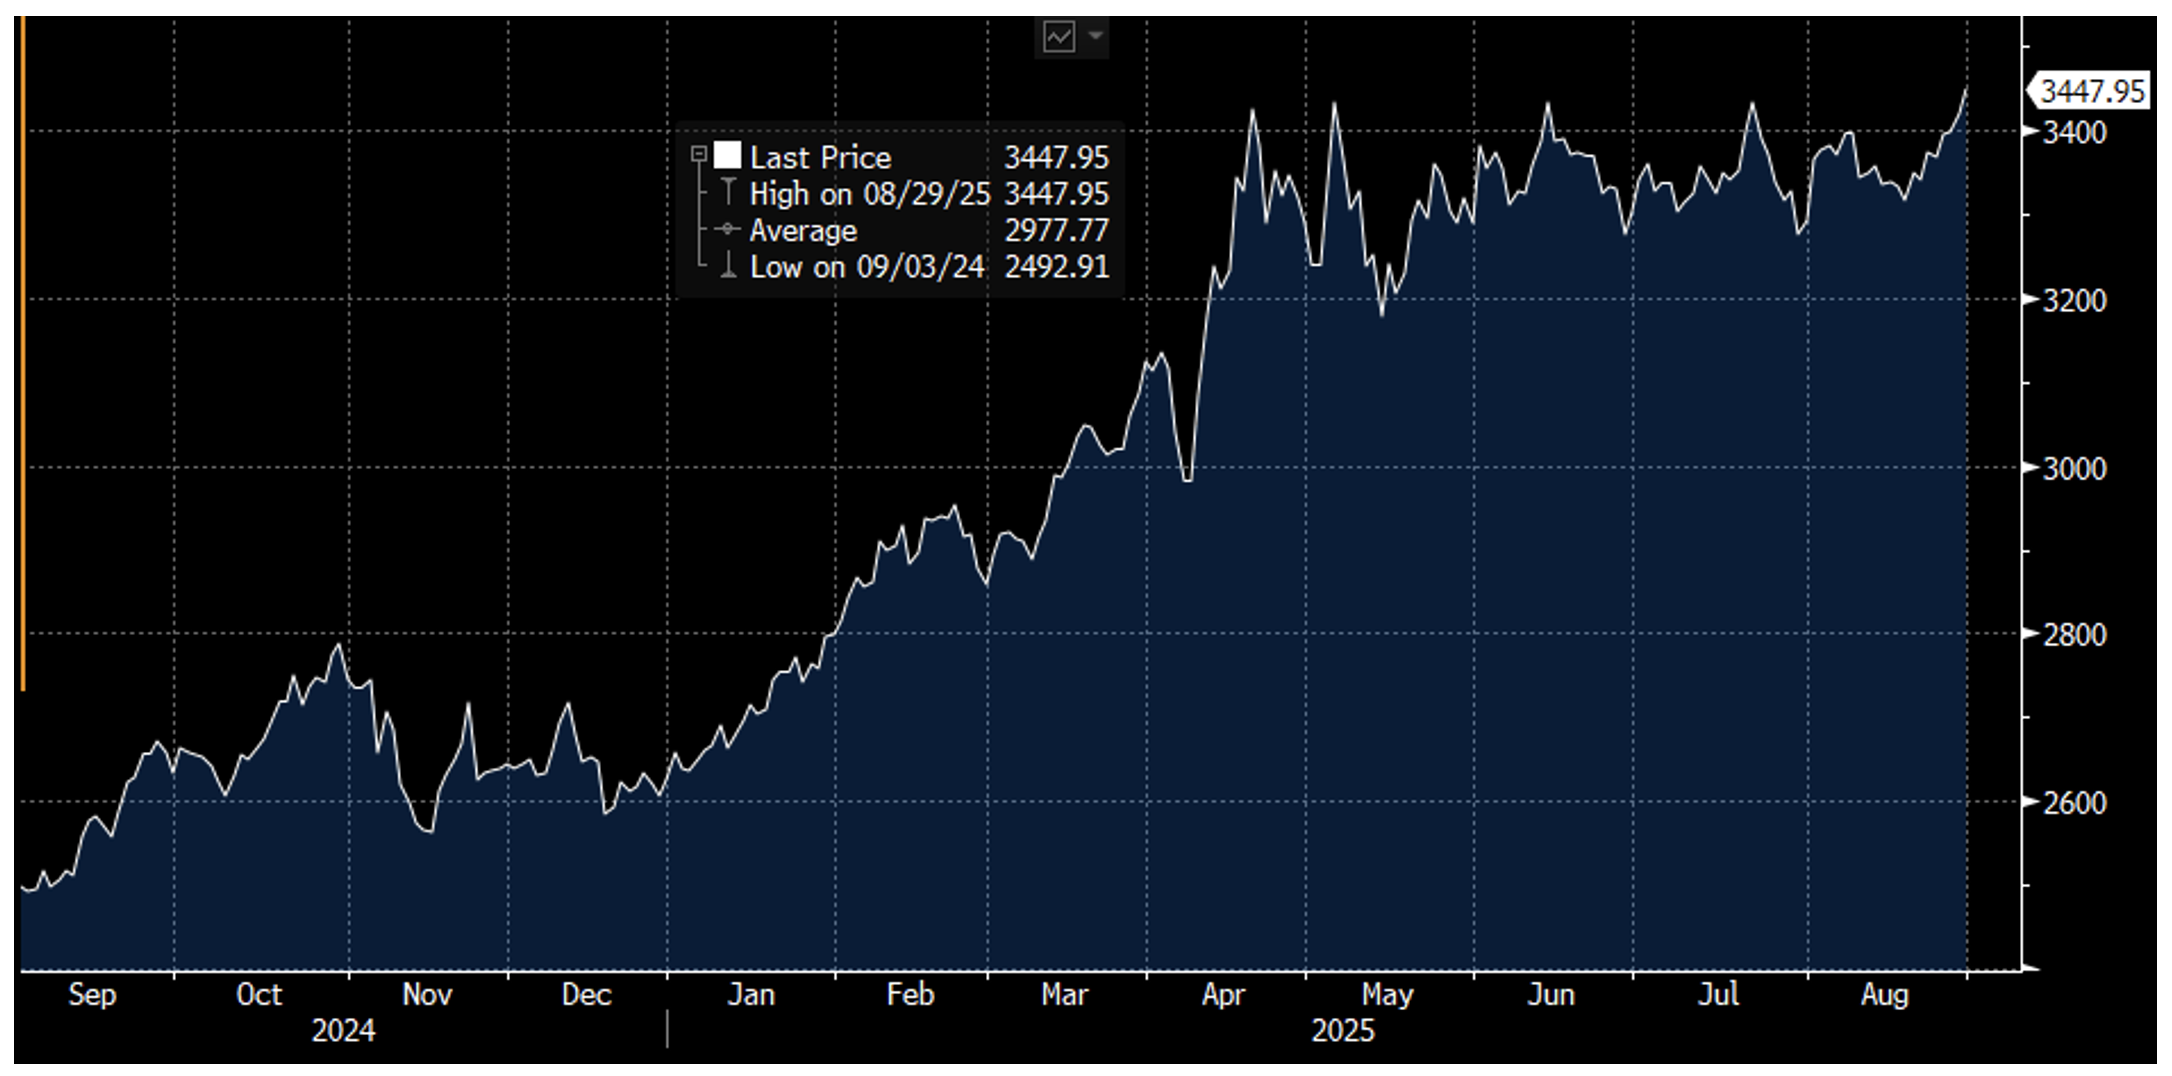
Source: Bloomberg L.P.
Oil:
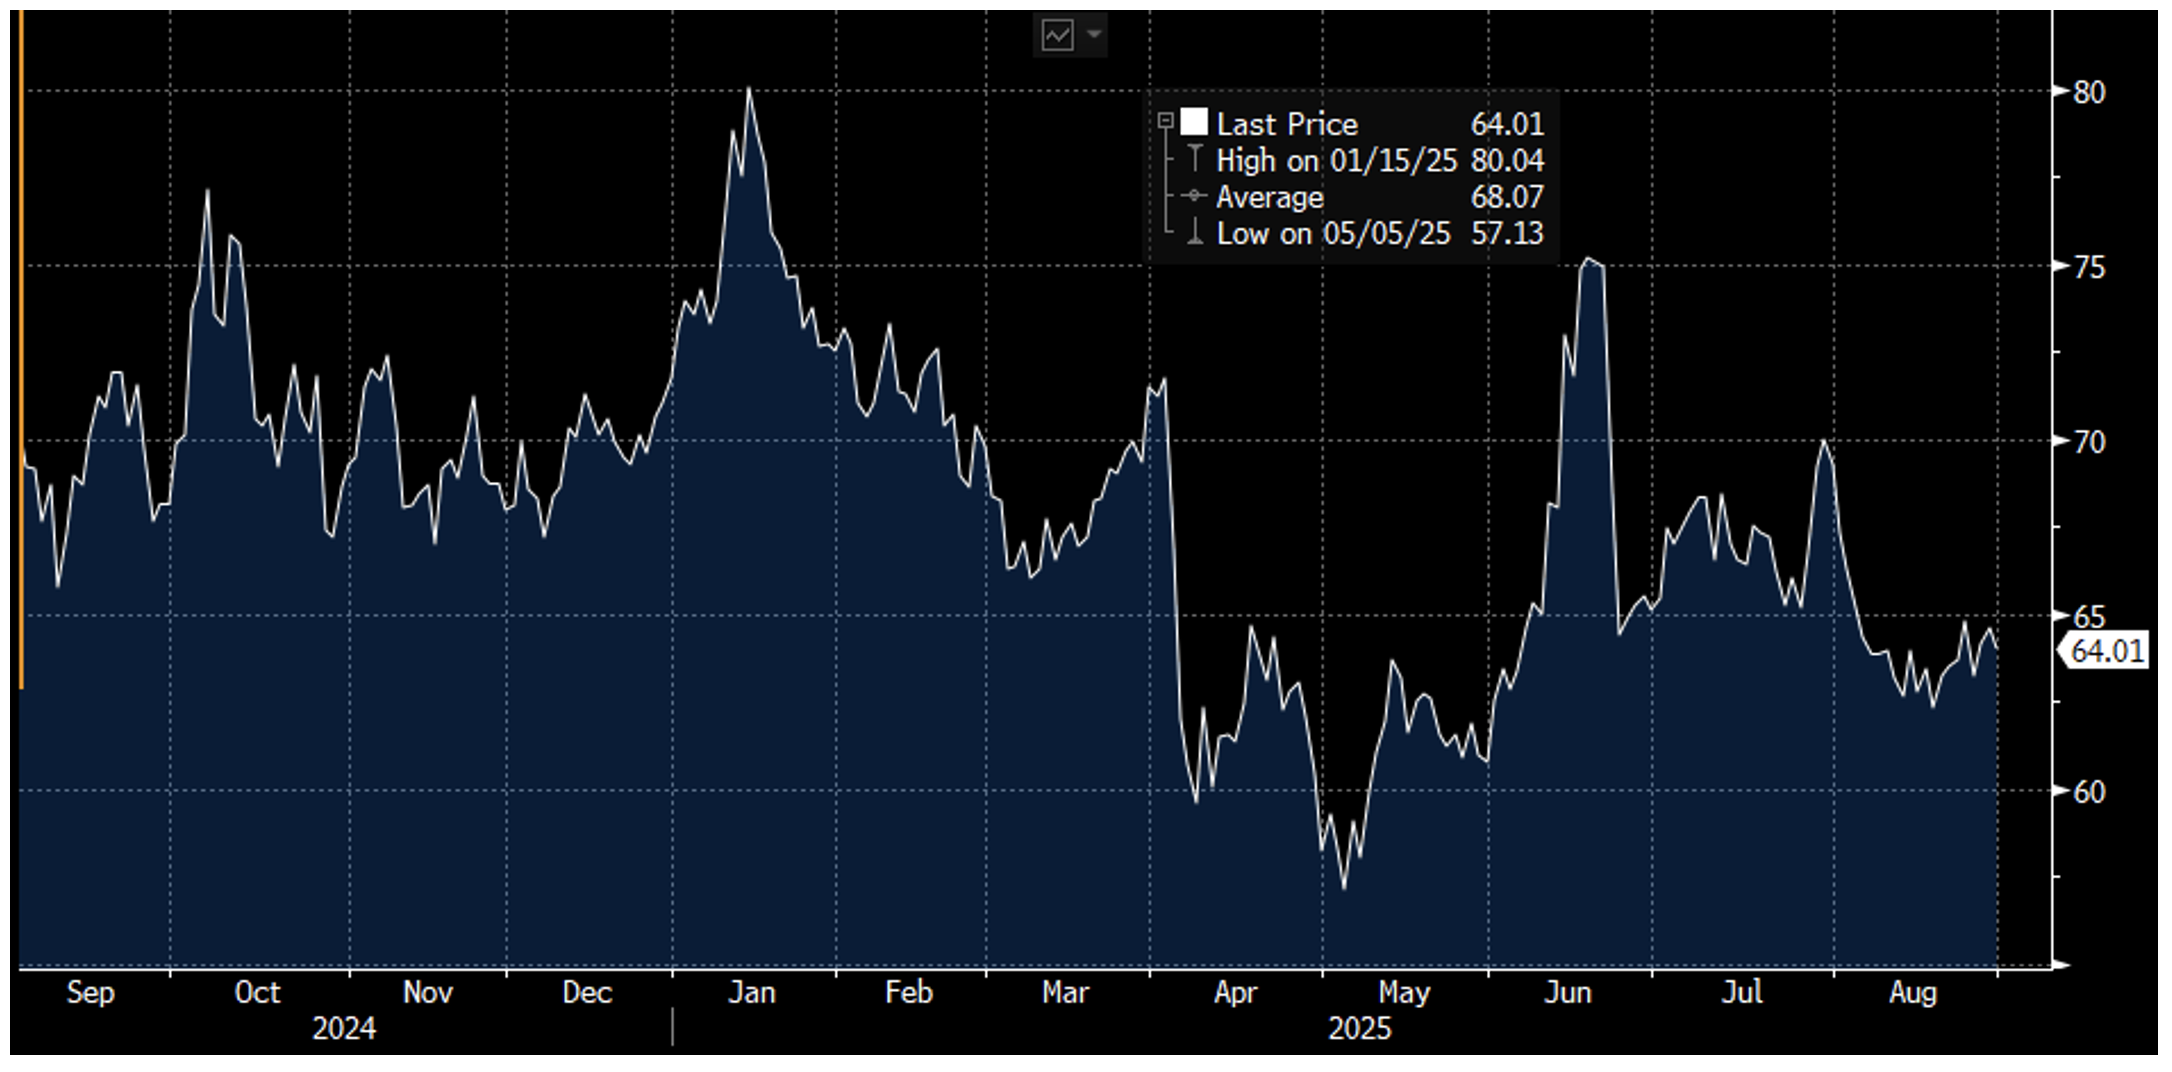
Source: Bloomberg L.P.
DXY:
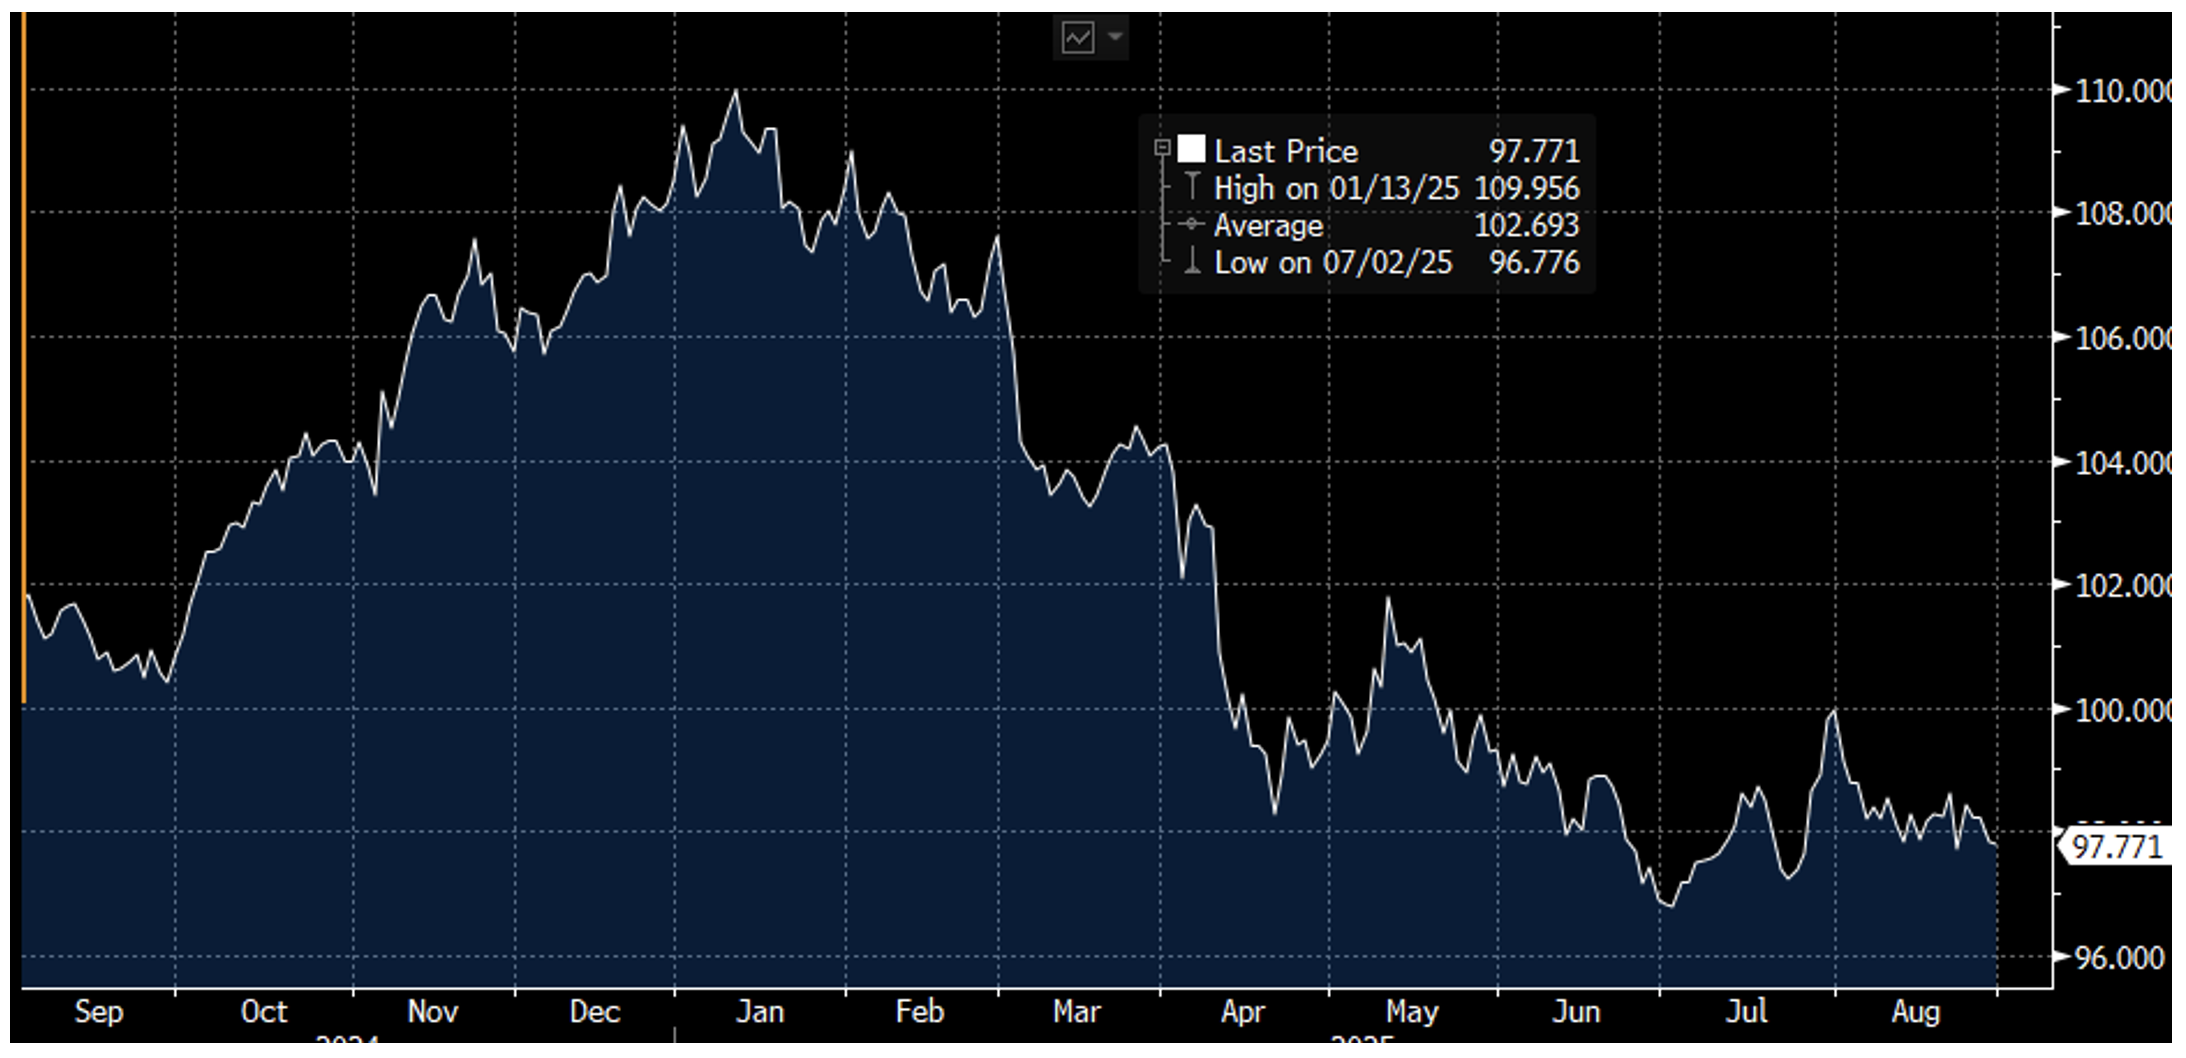
Source: Bloomberg L.P.
Looking ahead:
Markets are entering the month on a cautious note, with rising bond yields, stretched valuations, and tariff uncertainty contributing to a risk-off tone. Friday's nonfarm payrolls report for August will be in focus. Economists predict the unemployment rate to rise to 4.3% with 75,000 new jobs added. The reading will come amid labor market softening and economic uncertainty. Layoffs in 2025 have already hit 744,000, the highest since the pandemic. Political interference at the Federal Reserve and global geopolitical tensions are adding to volatility, making investor sentiment highly sensitive to incoming data and central bank signals.
Economic Calendar for September:
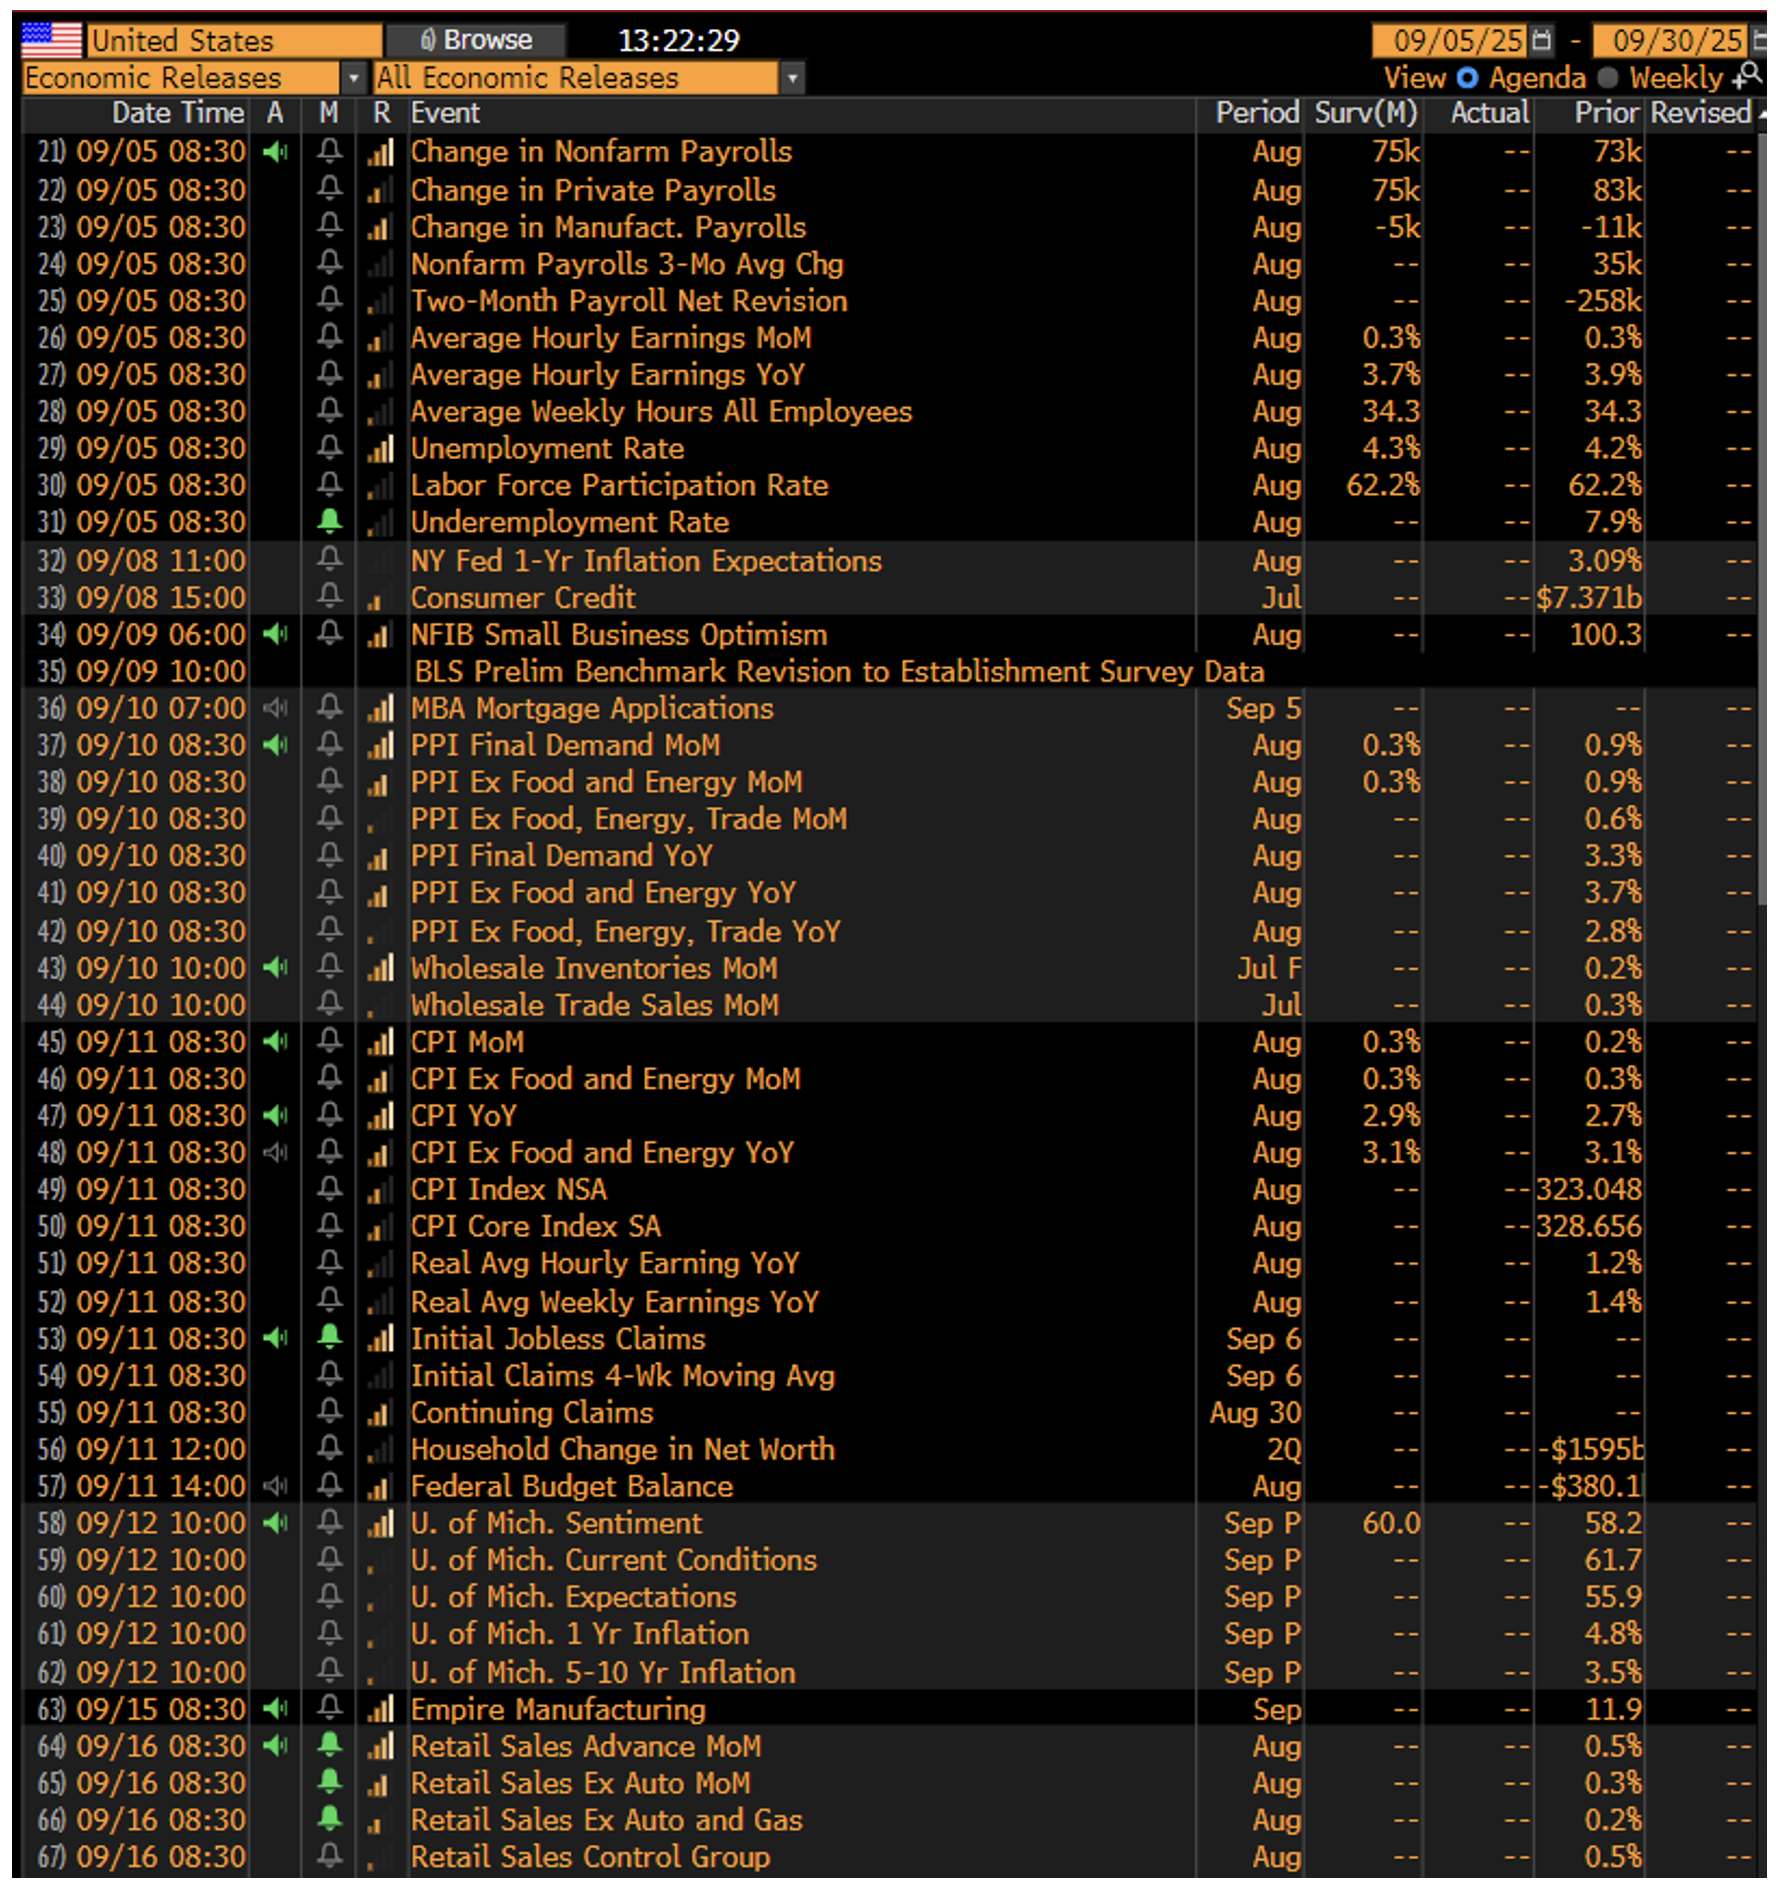
Source: Bloomberg L.P.
The information contained herein is provided for informational and educational purposes only, and nothing contained herein should be construed as investment advice, either on behalf of a particular security or an overall investment strategy. All information contained herein is obtained by Nasdaq from sources believed by Nasdaq to be accurate and reliable. However, all information is provided “as is” without warranty of any kind. ADVICE FROM A SECURITIES PROFESSIONAL IS STRONGLY ADVISED.

This data feed is not available at this time.
Data is currently not available
Latest articles
This data feed is not available at this time.
Data is currently not available


