
August 2023 Review and Outlook
Executive summary:
- U.S. long-term debt downgraded by Fitch
- Disinflation narrative playing out despite robust employment
- S&P 500 & Nasdaq posted their first monthly declines since February
- Corporate profits declined for the 3rd straight quarter but were better than expected
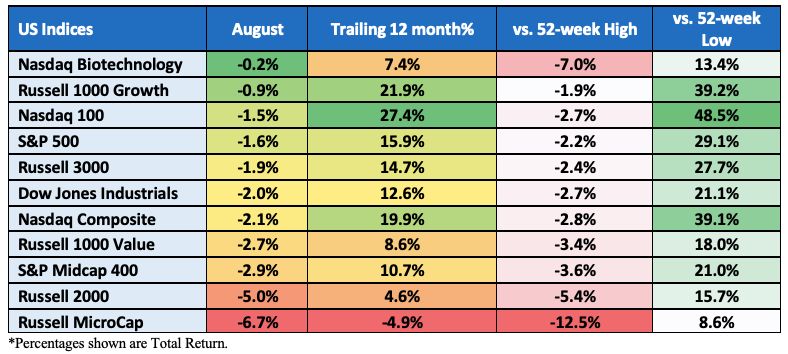
Index performance for August:
Sector performance total return for August:

U.S. equities finished lower in August as the S&P 500 and Nasdaq-100 Indices posted their first monthly declines since February. The “Magnificent Seven,” responsible for over 75% of the Nasdaq 100 gains in 2023 through July, saw mixed results for the month. While AI is still a major growth topic here, the Nasdaq 100 (heavily weighted in the tech space and thus the AI discussion) declined 1.5% for the month yet is still up over 42% YTD.
The U.S. government’s credit rating was downgraded one notch (AAA to AA+) at the beginning of the month by Fitch Ratings, citing rising debt at the federal, state, and local levels and a “steady deterioration in standards of governance” over the past two decades.
The downgrade, along with heavy treasury issuance, BOJ actions and changing views on “higher for longer” interest rates, caused U.S. treasury yields to move from below 4% to as high as 4.35% before ending August at 4.11%. The bond market volatility caused stocks to sell off for most of the first three weeks of the month before they staged a rebound in the final week.
Fed Chair Powell, in his Jackson Hole speech, took a middle-of-the-road stance with plenty of takeaways for both bears and bulls. Reaffirming a data-dependent approach, Chair Powell (as well as ECB president Christine Lagarde and other central bank policymakers) will continue to “proceed carefully” while assessing incoming economic data affirming their commitment to reducing inflation to the 2% target level. Powell “will proceed carefully as we decide whether to tighten further or, instead, to hold the policy rate constant and await further data.”
China’s economic growth concerns also played a role in the August pullback. Credit, economic and deflation data all came in weaker than expected, including an unexpected rate cut, rule changes on equity trading, weak consumer confidence, mortgage rate cuts, limiting access to youth unemployment data and bankruptcy filings by some of the country’s largest real estate developers. The Golden Dragon China Index was down over 16% in August before rallying at month’s end to close out down 10.3%.
With inflation falling and the labor market softening, the “soft-landing” scenario may happen over time (see the “Economic Commentary” section below for more details). The belief the Fed may not need to raise rates again is playing out as Fed fund futures are now pricing in only a 40% chance of a 25bps hike by year-end.
Rate Hike Odds for September suggest no change:

…And suggest cuts in 2024:

Nasdaq-100, one year:

Treasuries:
The U.S. bond market saw a significant selloff this month, driving 10-year yields to 16-year highs. The yield on the benchmark U.S.10-year Treasury now sits at 4.10%, down from a high of 4.35% earlier in the month. The 30-year yield now sits at 4.21%. Shorter term 2s were little changed for the month, yielding 4.85%. The yield curve has remained inverted for over one year.
10-Year Treasury Constant Maturity Minus 2-Year Treasury Constant Maturity:

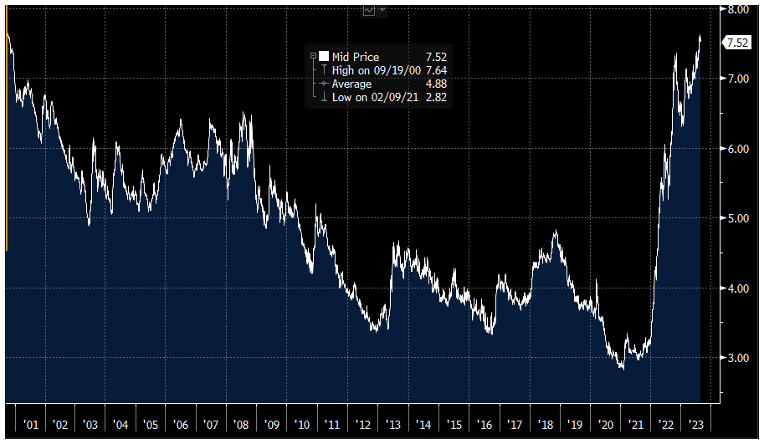
30-Year Mortgage Rates at highest levels in over 20 years:
Earnings commentary:
S&P 500 companies reported their 3rd straight quarter of Y/Y declines at -4.1%, which is better than the expected 9% drop analysts predicted at the beginning of the season. According to Bloomberg data, the average upside beat was 7.79% for the quarter, while sales increased by 2.00%. The earnings growth rate declined 5.95%, while sales growth rose nearly 1%. Sectors that saw outsized earnings growth included Consumer Discretionary (+34%), Communications (+15%) and Real Estate (+8%), while Energy (-51%), Materials (-29%) and Health Care (-27%) declined. Interestingly, FactSet pointed out that 288 of the S&P 500 constituents mentioned the term “inflation” on their Q2 calls.
Economic commentary:
The U.S. Department of Labor’s August 4th Employment Situation Report for July posted a slightly weaker-than-expected number on job creation, coming in below 200,000 for the 2nd straight month (+187,000 new vs. +200,000 consensus). However, a lower unemployment rate (+3.5% vs. 3.6% consensus) and stronger than expected hourly wage growth (+0.4% vs. 0.3%) reinforced the idea of a robust labor market, near full employment. The report was not strong enough for the FED to raise the terminal rate, nor is it weak enough to cut rates in the near term. The labor force participation rate remained steady at 62.6%.
July’s headline CPI was in-line with expectations at +0.2% M/M and up 3.2% Y/Y compared to 3.0% in June. Core-CPI, which excludes food and energy, was also up 0.2% M/M (in-line with consensus) and up 4.7% Y/Y vs. +4.8% in June. This is the first monthly increase in CPI inflation since July 2022. Shelter (+0.4% M/M and +7.7 Y/Y) was again the largest contributor to the increase in total CPI and core CPI. As far as the market is concerned, there were no hawkish surprises in the report to disrupt the disinflation narrative.
PPI increased last month. July PPI rose 0.3% (consensus +0.2%), though the prior month was revised to flat from +0.1%. July Core PPI increased +0.3% (also above consensus), though June was also revised lower to -0.1% from +0.1%. Total PPI Y/Y increased 0.8%, below estimates of +0.7%. PPI, ex-food and energy, was up 2.4% Y/Y versus a consensus of +2.3%
Retail sales (which do not adjust for inflation) rose for the 4th straight month, boosted in July by Amazon’s Prime Day and spending on entertainment and food services. Total retail sales increased by 0.7% M/M (consensus +0.4%) following an upwardly revised June (+0.3% from 0.2%). Ex-autos, retail sales increased 1%, well above the 0.4% whisper number.
The Federal Reserve Bank of New York reported that American credit card debt has increased by over 30% in the last two years, surpassing the $1 trillion mark for the first time. Credit card debt is often associated with higher prices (caused by inflation), rising interest rates and strong consumer confidence. The higher credit card usage might be interpreted as a sign that consumers are running out of savings. With the average credit card interest rate now over 20%, that could eat into future discretionary spend. The report also noted that delinquency rates are at an 11-year high.
U.S. Initial Jobless Claims (a leading indicator) remain at levels consistent with a tight labor market. For the week ending August 26th, new claims were 228,000 (consensus 235,000), below the four-week average of 237,500 claims. Continuing jobless claims increased to 1.725 million from 1.697 million.
The U.S. Department of Commerce released a downwardly revised estimate for Q2’23 GDP. The second estimate numbers showed the economy grew by 2.1% annually, below the advance estimate of 2.4%, fitting in with the soft-landing scenario. The GDP Chain Deflator (price index) was also revised lower to 2.0% from 2.2%.
Personal income increased 0.2% in July (below 0.3% consensus), while personal spending increased 0.8% (consensus of +0.7%), above June’s upwardly revised +0.6% level. The personal savings rate, as a percentage of disposable personal income (DPI), decreased to its lowest level this year to 3.5% from 4.3% in June.
The PCE Price Index was up 3.3% Y/Y, vs. +3.0% in June, and the core PCE Price Index, which excludes food and energy, rose 4.2% vs. +4.1% in June. On a monthly basis, both the PCE deflator and core rose 0.2%.
The Conference Board’s Consumer Confidence Index fell in August to 106.1 (consensus was 116). The Expectations Index (based on consumers’ short-term outlook for income, business and labor market conditions) decreased to 80.2 from 88 last month. A reading of 80 or below is historically associated with a recession within the next year.
According to Bloomberg, “August’s deterioration in US consumer confidence signals that the recent spending splurge won’t last. Inflation remains elevated, and interest rates have surged, putting rate-sensitive purchases out of reach for many households. In turn, consumers have shifted their spending toward experiences, which are easier to finance with credit cards.”
CPI Inflation – YoY:

Oil:
Oil futures rose over 2% in August after gaining more than 15% in July. This marks the 3rd straight month of gains for crude. Fears of Hurricane Idalia disrupting production in the Gulf, coupled with a report of lower-than-expected U.S. crude stockpiles, helped drive a late-month rally.
Crude Oil front month contract for August:

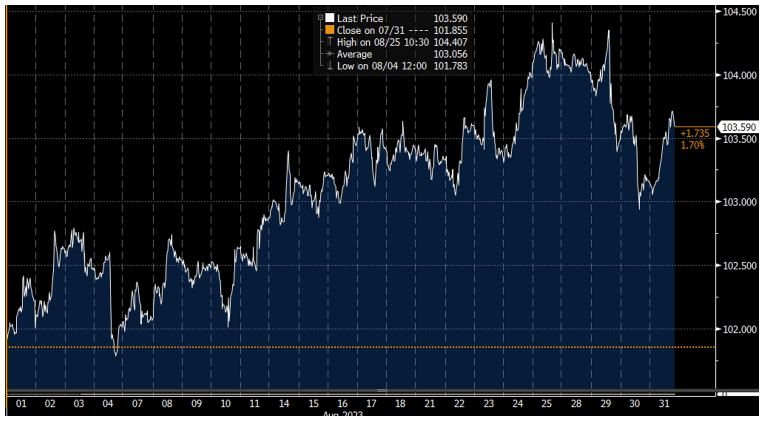
Dollar:
The dollar rose over 1.7% in August yet is still down nearly 8% since last September’s peak. The Fed’s tightening cycle that began in March of last year helped power the greenback’s gains last year, as higher rates helped attract overseas investors. A strong dollar tends to hold back stocks and other risky investments, as S&P 500 companies generate more than a third of their revenue from outside the U.S. As expectations grow that the Fed will halt interest-rate hikes soon, speculators are wagering that the dollar could lose more steam.
Looking ahead:
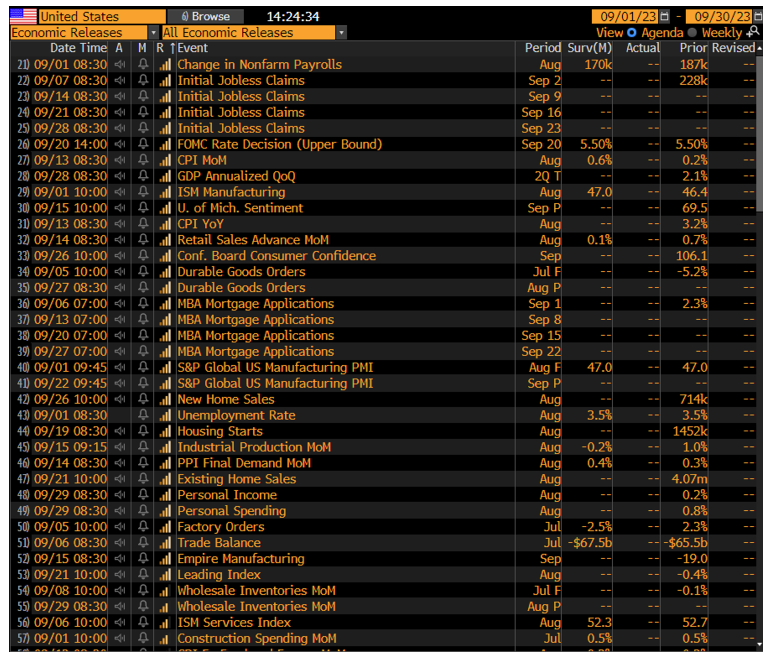
Seasonally, September is one of the worst months for equities. The S&P 500 has averaged a decline of 1.08% over the past 50 years. On the , the August Jobs report is released Friday morning (9/1). Economists are expecting the unemployment rate to remain at 3.5%. CPI will be released on Sept. 3, followed by PPI on the 14th. The FOMC rate decision will be on Sept. 20. On Sept. 15, we have “triple witch” options expiration and the concurrent S&P Index rebalancing.
The information contained herein is provided for informational and educational purposes only, and nothing contained herein should be construed as , either on behalf of a particular security or an overall investment strategy. All information contained herein is obtained by Nasdaq from sources believed by Nasdaq to be accurate and reliable. However, all information is provided “as is” without warranty of any kind. ADVICE FROM A SECURITIES PROFESSIONAL IS STRONGLY ADVISED.
The views and opinions expressed herein are the views and opinions of the author and do not necessarily reflect those of Nasdaq, Inc.
Other Topics
Central Banks Indexes Earnings Economy Oil
The Market Intelligence Desk Team
Nasdaq
Nasdaq’s Market Intelligence Desk (MID) is designed to provide critical touch-points for timely trading analysis and market information.