
Analyzing the 2022 Stock Splits
This year we’ve had some notable stock splits, including Alphabet (GOOG, GOOGL), Amazon (AMZN), Shopify (SHOP), Tesla (TSLA) and, of course, Nasdaq (NDAQ)!
Today we take a look at post-stock split tradability for all these stocks. The results confirm our earlier findings that splits fundamentally improve tradability, which saves investors and helps increase valuations.
20 splits so far in ‘22
So far, 20 stocks have had a split in 2022 with split ranges from 2:1 to 20:1. The data in Chart 1 shows this year’s splits:
- Have come from a range of market cap sizes, with only eight (40%) from companies with more than a $10 billion market cap.
- Stocks have started with prices below $50 to well over $1,000, although the majority split from a $50-$200 stock price.
- Although the two 20:1 splits (Alphabet and Amazon) were high profile in the industry, most splits were 3:1 or less.
Chart 1: Three breakdowns of 2022 stock splits

Tradability mostly improved
We know that splits can change stock tradability fundamentally. By reducing the cost of round lots and the quantity of ticks between the NBBO, spreads actually tighten, and liquidity often improves. As a result, more trading at lower spread should save investors money. It can also help lower volatility caused by larger trades.
Looking at this year’s splits, we see that spreads, volatility and value traded have all declined post-split on average (see dots in the chart below). Spreads have, on average, fallen over 60% — partly because of the large split ratios and very high prices with wide spreads of some of this year's splits.
That’s obviously a little different from the longer-term average, which includes 117 splits between 2009 – 2021 (see arrows in the chart below), where spreads improved by 28%, liquidity (value traded) increased 12% and intraday volatility reduced 4%.
However, as always, not all stocks were average. We take a deeper dive into a selection of the high-profile 2022 splits later in the analysis.
Chart 2: Looking at how 2022 tradability has changed (dots) compared to normal (arrows)

Tracking this year’s high-profile splits
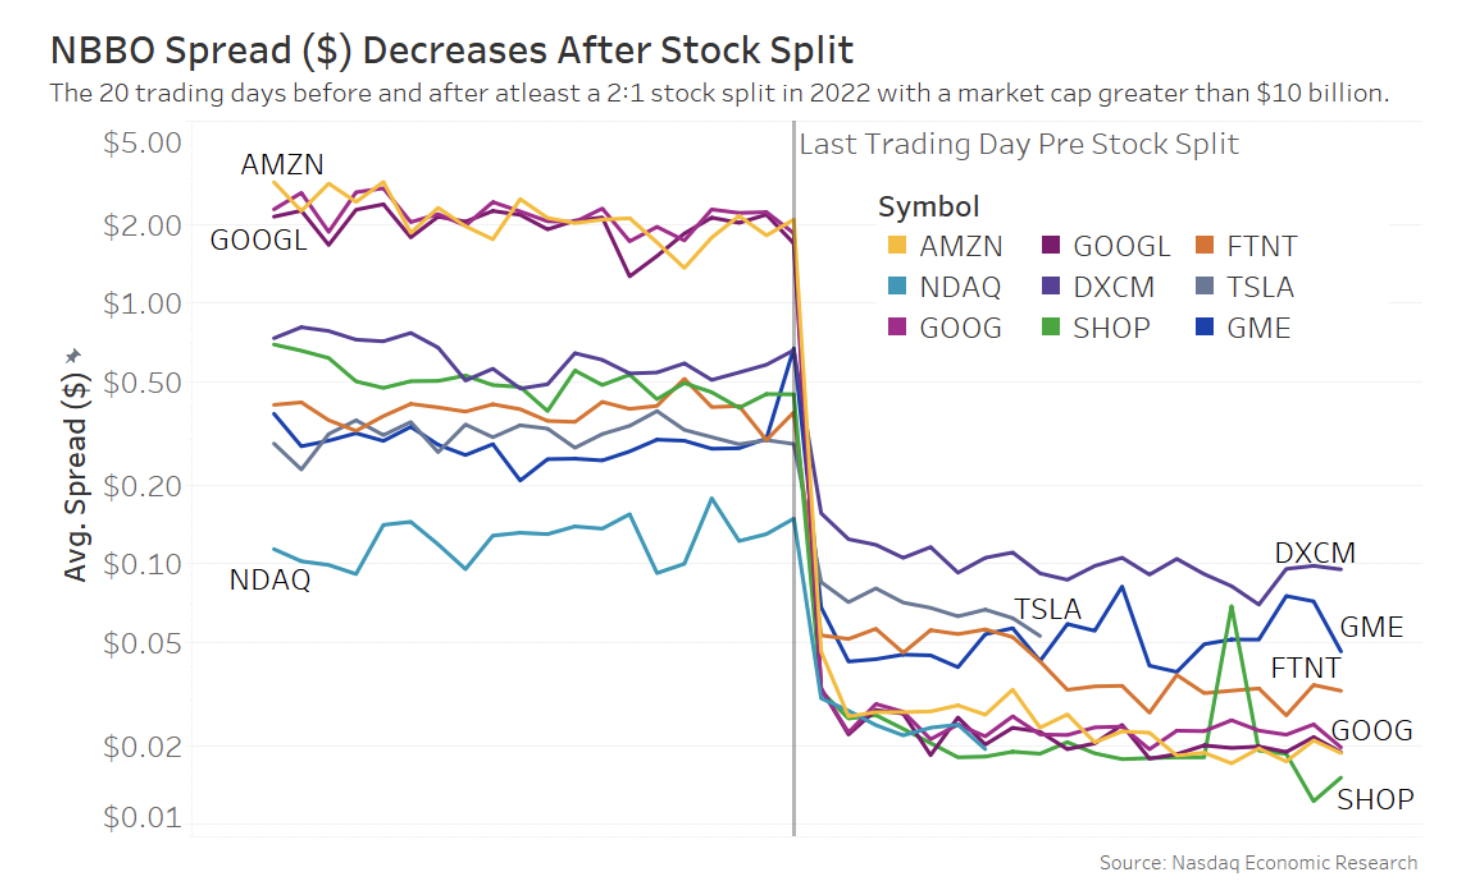
Looking in more detail at some of this year’s higher-profile splits, what stands out is how immediate many of the trading effects are – especially on things like odd lots, spreads and intraday volatility.
Looking first at spreads, we see the market adjust to the new stock price almost immediately, bringing competing old multi-tick spreads back down to closer to 2 cents. That’s important because we and others have found that is an optimal level for trading.
Chart 3: Spread quickly falls to closer to 2 cents
Of course, all stocks still trade on a 1-cent tick. So, if a stock’s price falls from $100 to $10, the cost to investors of each tick increases from 1 basis point to 10 basis points.
Despite that, the data shows that the new spreads are also smaller in basis points. In all instances, the spreads have trended down after the split date – although the savings are more dramatic for higher-priced stocks that needed larger splits to reach their new optimal price.
Chart 4: Even adjusting for the lower price, spreads fall

We see a similar result for odd lots. Almost immediately, the proportion of odd lot trades and volume is cut — fairly dramatically — for all tickers in this focus group.
In fact, before these splits, all these stocks had 30% or more of their volume in odd lots, and sometimes as high as 60%. After the splits, no stocks had 30% of their volume in odd lots, and some fell as low as 10%.
Chart 5: Odd lot volume is also cut

Intraday volatility affects traders' working orders too. A stock with higher volatility, by definition, is more likely to move away from recent prices more quickly. That can make it harder to trade without signaling and impact.
The math of calculating intraday volatility is complicated, mostly because price moves are somewhat mean-reverting over time, so you can’t extrapolate a 1-second return series to get average volatility as you can with daily close prices. But also, because trading speeds up and slows down within the day - with the open typically seeing much more volatility than the close. Furthermore, because a stock’s “last price” can bounce between the bid and offer (volatility) even if the quotes and midpoint don’t move it creates a false impression of volatility, especially if ticks are wider in basis points.
Instead, we calculate intraday volatility by comparing variance ratios over different timeframes, which is consistent with what other experts have done.
Our results show intraday volatility decreased for 71% (five of the seven) stocks we are looking at. That’s roughly in line with our earlier work showing that 66% of the stocks that split from 2012 – 2020 saw reduced intraday volatility. Notably, we are excluding a couple of stocks as we can’t calculate 20-day volatility because their splits are too recent.
Chart 6: Intraday volatility

However, we also find that the two other stocks, AMZN and GME, which had increased intraday volatility, were likely impacted by events that overwhelmed the impact of the split. Both split around the same time that Walmart and Target revealed they had too much post-covid inventory and might need to start discounting. Amazon also laid out a plan to sublease warehouse space to reduce excess capacity.
Trading is cheaper and simpler; investors should be saving $100 million per year
Importantly, the results from 2022’s largest splits still say stock splits improve tradability. Spreads, odd lots and volatility have all fallen. That makes trading easier and cheaper for investors.
In fact, based on the methodology we developed for Chart 8 here, we estimate investors are now saving over $100 million in trading costs per year. And that’s a fundamentally good thing.
Other Topics
Market Infrastructure US Markets
Phil Mackintosh
Nasdaq
Phil Mackintosh is Chief Economist and a Senior Vice President at Nasdaq. His team is responsible for a variety of projects and initiatives in the U.S. and Europe to improve market structure, encourage capital formation and enhance trading efficiency.
Read Phil's Bio