Banks are making headlines for all the wrong reasons in the wake of what appeared to be idiosyncratic issues at the Silicon Valley Bank. The failure of this California bank and the travails of First Republic Bank FRC have put a harsh spotlight on the entire regional banking space.
The chart below should give you a sense of the strain in the regional banking space. The chart shows the year-to-date performance of First Republic Bank and the Zacks Banks & Thrifts industry. The chart also shows JPMorgan JPM as a proxy for the large money-center banking group and the S&P 500 index.
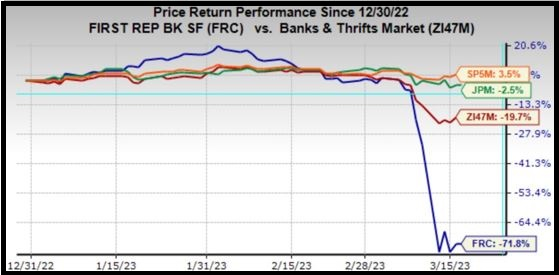
Image Source: Zacks Investment Research
This isn’t a replay of what the industry went through in 2008. Still, it nevertheless adds to uncertainty about macroeconomic stability at a time when the U.S. Fed’s unprecedented monetary policy tightening has been weighing on the economy’s growth trajectory.
We should also note that the regulatory changes implemented through Dodd-Frank following the 2008 crisis have effectively ringfenced the large banks. These large banks and financial institutions routinely go through ‘stress tests’ by the U.S. Fed that ensures that they can operate in a variety of stressful market conditions.
We can say with a high degree of confidence that the exemption that these regional and smaller banks enjoyed from Dodd-Frank’s strenuous regulatory oversight will end after the ongoing crisis is resolved.
We don’t know the specifics of the new regulations these regionals will be required to face in the future, but they will definitely have more capital requirements. This additional capital cushion will come at the expense of reduced profitability and lower returns from the group going forward.
Many in the market see the ongoing regional-banking industry questions as having a bearing on monetary policy as well. We see some of that in the pullback in treasury yields in recent days. Futures markets also indicate a reversal of the earlier ‘higher-for-longer’ view of the Fed Funds ‘exit rate’, the final level at which the central bank concludes the ongoing tightening cycle.
We will get a good sense of how the Fed sees these questions after this week’s FOMC meeting.
All of this has direct earnings implications for the U.S. economy’s growth trajectory and the health of corporate profitability.
To get a sense of what is currently expected, take a look at the chart below that shows current earnings and revenue growth expectations for the S&P 500 index for 2023 Q1 and the following three quarters.
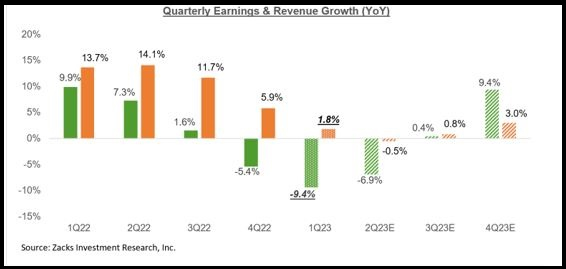
Image Source: Zacks Investment Research
As you can see here, 2023 Q1 earnings are expected to be down -9.4% on +1.8% higher revenues. This would follow the -5.4% earnings decline in the preceding period (2022 Q4) on +5.9% higher revenues.
Embedded in these 2023 Q1 earnings and revenue growth projections is the expectation of continued margin pressures, which has been a recurring theme in recent quarters. The chart below shows net income margins for the S&P 500 index.
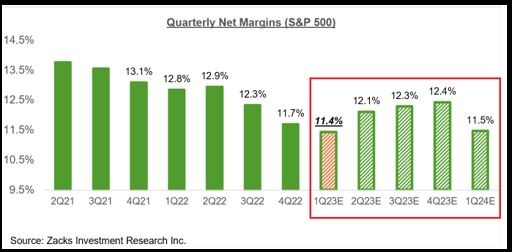
Image Source: Zacks Investment Research
Analysts have been steadily lowering their estimates for Q1, a trend that we saw ahead of the start of the last few reporting cycles as well.
To give full context, this behavior of negative estimate revisions just ahead of the start of the reporting cycle for that period is far from the course, historically speaking. We saw this shift during Covid when estimates started going up for some time. But that trend ‘normalized’ last year and hence the negative revisions to 2023 Q1 estimates, as the chart below shows.
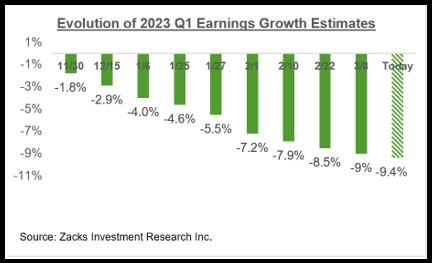
Image Source: Zacks Investment Research
Please note that while 2023 Q1 estimates have come down, the magnitude of negative revisions compares favorably to what we saw in the comparable periods of the preceding couple of quarters. In other words, estimates haven’t fallen as much as they did in the last few quarters.
Estimates for full-year 2023 have also been coming down as well, as we have been pointing out consistently in these pages. The chart below shows how the aggregate 2023 S&P 500 earnings.
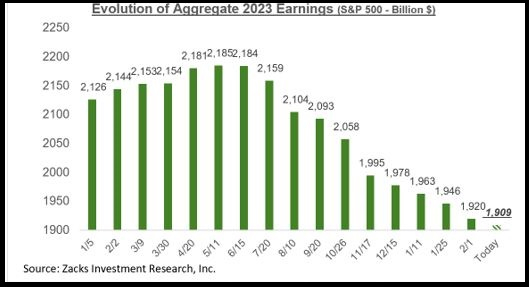
Image Source: Zacks Investment Research
As we have been pointing out all along, 2023 earnings estimates peaked in April 2022 and have been coming down ever since. Since the mid-April peak, aggregate earnings have declined by -12.3% for the index as a whole and -14.2% for the index on an ex-Energy basis, with the declines far bigger in a number of major sectors.
You have likely read about the roughly -20% cuts to S&P 500 earnings estimates, on average, in response to recessions.
Many in the market interpret this to mean that estimates still have plenty to fall in the days ahead. But as the aforementioned magnitude of negative revisions in excess of -14% on an ex-Energy basis show, we have already traveled a fair distance in that direction. Importantly, some key sectors in the path of the Fed’s tightening cycle, like Construction, Retail, Discretionary, and even Technology, have already gotten their 2023 estimates shaved off by a fifth since mid-April.
We are not saying that estimates don’t need to fall any further. If nothing else, estimates for the Finance sector will need to come down in the wake of the ongoing banking industry issues. But rather that the bulk of the cuts are likely behind us, particularly if the coming economic downturn is a lot less problematic than many seem to assume or fear.
Please note that the $1.909 trillion aggregate earnings estimate for the index in 2023 approximates to an index ‘EPS’ of $215.51, up from last week’s $214.86, but down from $221.22 in 2022. The chart below shows how this 2023 index ‘EPS’ estimate has evolved over time
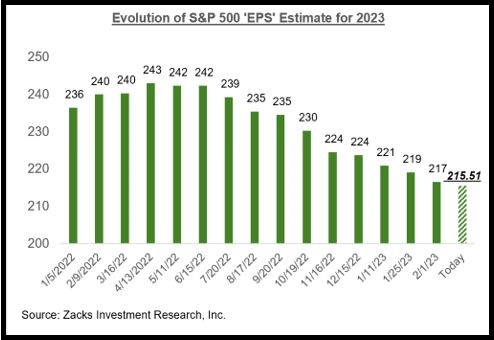
Image Source: Zacks Investment Research
The chart below shows the earnings and revenue growth picture on an annual basis.
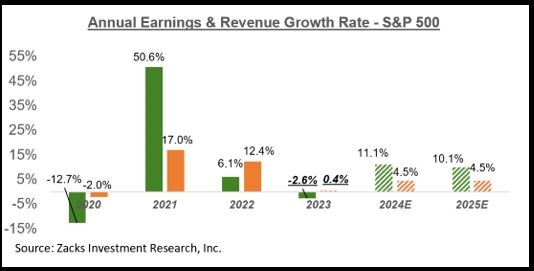
Image Source: Zacks Investment Research
This Week’s Reporting Docket
The Q1 earnings season will really get underway when JPMorgan JPM and the other big banks come out with their quarterly results in mid-April. But the reporting cycle has actually gotten underway already, as we saw with results from FedEx FDX, Oracle ORCL, and four other S&P 500 members in recent days.
The results from FedEx, Oracle, and the other index members that reported in recent days were for their fiscal quarters ending in February. JPMorgan and the banks will be reporting results for their fiscal periods ending March. We and other data vendors count these February-quarter results as part of the 2023 Q1 tally.
We have another 5 S&P 500 members on deck to report such February-quarter results this week, including Nike NKE on Tuesday, March 21st.
For a detailed look at the overall earnings picture, including expectations for the coming periods, please check out our weekly Earnings Trends report >>>> Will Tech Sector Earnings Growth Resume in Q1?
Zacks Names "Single Best Pick to Double"
From thousands of stocks, 5 Zacks experts each have chosen their favorite to skyrocket +100% or more in months to come. From those 5, Director of Research Sheraz Mian hand-picks one to have the most explosive upside of all.
It’s a little-known chemical company that’s up 65% over last year, yet still dirt cheap. With unrelenting demand, soaring 2022 earnings estimates, and $1.5 billion for repurchasing shares, retail investors could jump in at any time.
This company could rival or surpass other recent Zacks’ Stocks Set to Double like Boston Beer Company which shot up +143.0% in little more than 9 months and NVIDIA which boomed +175.9% in one year.
Free: See Our Top Stock and 4 Runners Up >>JPMorgan Chase & Co. (JPM) : Free Stock Analysis Report
NIKE, Inc. (NKE) : Free Stock Analysis Report
Oracle Corporation (ORCL) : Free Stock Analysis Report
FedEx Corporation (FDX) : Free Stock Analysis Report
First Republic Bank (FRC) : Free Stock Analysis Report
To read this article on Zacks.com click here.
The views and opinions expressed herein are the views and opinions of the author and do not necessarily reflect those of Nasdaq, Inc.


