If things seem tough for the average American, you can bet they’re a lot worse for those in lower income brackets. In fact, income inequality in America has increased in many American cities, but a handful stand out as being particularly out of balance.
To determine the states with the most income inequality, GOBanking rates analyzed data from the American Community Survey of the U.S. Census on American cities — including the District of Columbia — using the Gini coefficient, which represents the wealth distribution in an area. The Gini coefficient ranges from zero to one, with one representing complete inequality and zero meaning everyone earns the same income. For clarity, Gini coefficients are presented here as percentages, with 0.5 equaling 50%, for example.
Find Out: Here’s the Income Needed To Be in the Top 1% in All 50 States
Read Next: The Surprising Way You Can Get Guaranteed Retirement Income for Life
According to Census Bureau data, the United States as a whole has a Gini coefficient of 48.2%, which is a tad bit lower than it was in 2023, when it was 48.5%, the highest it had been in 50 years. Overall, Gini coefficients in the U.S. have a fairly tight range — just 10 U.S. states have higher-than-average Gini coefficients, and they are listed below in reverse order, from smallest to largest. Additionally, data regarding average incomes of the bottom 20% and top 5% is also provided.
Take a look at the 10 states with the most income inequality.

Illinois
- Average Income of Bottom 20%: $16,165
- Average Income of Top 5%: $503,970
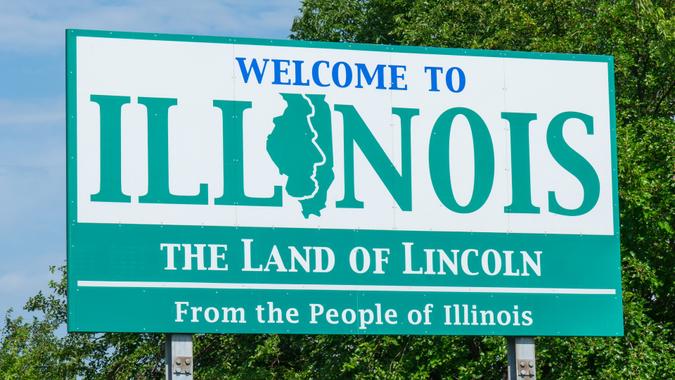
Illinois has a Gini coefficient of 48%, slightly below the national average. The median household income here is only $78,433, however.
Plan Ahead: How Long $1 Million in Retirement Will Last in Every State
See More: States Whose Economies Are Failing vs. States Whose Economies Are Thriving

Arkansas
- Average Income of Bottom 20%: $12,745
- Average Income of Top 5%: $377,043
The Gini coefficient in Arkansas is 48%. The average income of the bottom 20% is the third lowest on this list.
Learn Now: How I Went From Middle Class to Upper Middle Class

Mississippi
- Average Income of Bottom 20%: $10,766
- Average Income of Top 5%: $333,597
The Gini coefficient in Mississippi is 48%. Here, the average income of the bottom 20% is the lowest on this list.

Florida
- Average Income of Bottom 20%: $15,579
- Average Income of Top 5%: $476,546
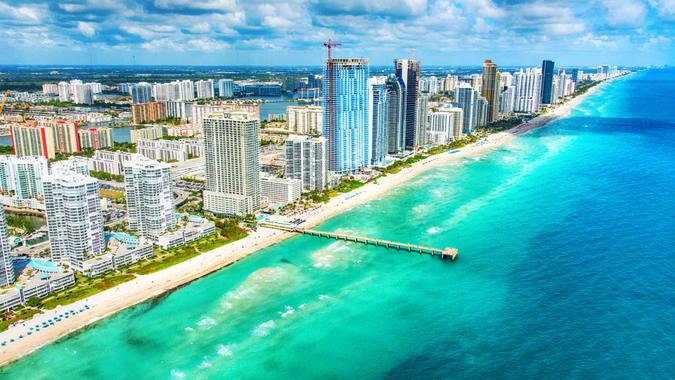
The wealth gap between the bottom 20% and the top 5% is stunningly high — $460,967. Florida’s Gini coefficient is 49%, just a bit above the national average.
Check Out: Here’s How Much the Definition of Middle Class Has Changed in Every State

Massachusetts
- Average Income of Bottom 20%: $18,123
- Average Income of Top 5%: $617,199
Massachusetts’ Gini coefficient comes in at 49%, but the gap between bottom 20% and top 5% is enormous, at $599,076.

California
- Average Income of Bottom 20%: $18,818
- Average Income of Top 5%: $613,602
The income disparity in California is best exemplified by the gap between the top earners and the bottom 20%. The Gini coefficient is over 49% and the wealth gap translates to nearly $600,000.

Louisiana
- Average Income of Bottom 20%: $11,192
- Average Income of Top 5%: $384,432
Louisiana is not a high-income state, but it sports a Gini coefficient of 50%.

Connecticut
- Average Income of Bottom 20%: $18,445
- Average Income of Top 5%: $656,438
Connecticut is a high-earning state for those not in the bottom 20% — in fact the average income of the top 5% is the second highest on this list. It has a Gini coefficient of 50%.
Real Estate: The Minimum Salary You Need To Buy a Home in 2024 in All 50 States

New York
- Average Income of Bottom 20%: $14,932
- Average Income of Top 5%: $621,301
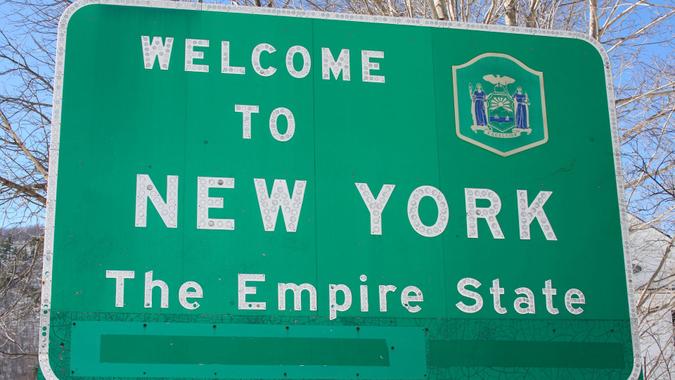
In New York, though the median household income is $81,385, the bottom 20% aren’t even close to touching that figure. Meanwhile the top 5% are making significantly more than even the national average for the top 5% (which is $494,992).

District of Columbia
- Average Income of Bottom 20%: $14,374
- Average Income of Top 5%: $719,253
Of anywhere in the country, income inequality is the most pronounced in the nation’s capital, with a Gini coefficient of 52%. The average income of the top 5% is the highest in the nation.
John Csiszar contributed to the reporting for this article.
Methodology: For this piece GOBankingRates looked at all states in the U.S. and found the following factors for each state: (1) Gini index measuring income inequality (definition below); (2) bottom 20% of earners average income; (3) top 20% of earners average income; (4) top 5% of earners average income; (5) bottom 20% of earners share of wealth; (6) top 20% of earners share of wealth; (7) top 5% of earners share of wealth; (8) median household income; and (9) average household income. For rankings only factor (1) was considered. All data was sourced from the 2022 American Community Survey as conducted by the U.S. Census Bureau. All data was collected and up to date as of July 17, 2024.
Gini index: The Gini index is a summary measure of income inequality. The Gini coefficient incorporates the detailed shares data into a single statistic, which summarizes the dispersion of income across the entire income distribution. The Gini coefficient ranges from 0, indicating perfect equality (where everyone receives an equal share), to 1, perfect inequality (where only one recipient or group of recipients receives all the income). The Gini is based on the difference between the Lorenz curve (the observed cumulative income distribution) and the notion of a perfectly equal income distribution.
More From GOBankingRates
- These Are America's Wealthiest Suburbs
- 10 Best Items To Buy at Five Below Before School Starts
- 5 Moves Every Woman Should Consider Before Retirement
- This is The Single Most Overlooked Tool for Becoming Debt-Free
This article originally appeared on GOBankingRates.com: 10 US States With the Most Income Inequality
The views and opinions expressed herein are the views and opinions of the author and do not necessarily reflect those of Nasdaq, Inc.


