Maxus Mining Continues to Return Strong Polymetallic Results at the Quarry Antimony Property in British Columbia, Canada
VANCOUVER, British Columbia, April 20, 2026 (GLOBE NEWSWIRE) -- Maxus Mining Inc. (“Maxus” or the “Company”) (CSE: MAXM | OTCQB: MXMGF | FRA: R7V) is pleased to provide a summary of analytical results from the 2025 field program at its Quarry Antimony Property (the “Project” or the “Property”), located in the Omineca Mining District in British Columbia (Please see Figure 1). Maxus engaged Palliser Exploration Ltd. (“Palliser”) to complete a reconnaissance field program across the Project in autumn 2025. The second batch of sample results from the 2025 exploration and sampling program (the “Program”) at the Project is summarized below (Please see Figure 2).
Quarry Project 2025 Field Program Highlights
- Strong Polymetallic Signatures: Recent results verify the polymetallic signature on the Project characterized in previous exploration programs, with several outcrop and grab samples returning significant anomalous values for silver (Ag), zinc (Zn), and lead (Pb) with associated antimony (Sb).
- Rock Sample Assay Highlights:
- 60.8 g/t Ag, 3.36% Zn, 4.09% Pb, in Sample G019851; and
- 23.7 g/t Ag, 10.5% Zn, 1.92% Pb, in Sample G019857.
- Previously Reported Rock Sample Assay Highlights:
- 234 g/t Ag, 110 ppm Sb, 0.46% Zn, 4.67% Pb, in Sample G019834;
- 121 g/t Ag, 67 ppm Sb, 0.74% Zn, 2.35% Pb, in Sample G019827;
- 52.1 g/t Ag, 68 ppm Sb, 9.62% Zn, 0.75% Pb, in Sample G019831;
- 11.1 g/t Ag, 2.83% Zn, 0.36% Pb, in Sample G019828;
- 10.5 g/t Ag, 4.39% Zn, 2.38% Pb, in Sample G019854;
- 9.4 g/t Ag, 4.86% Zn, 0.597% Pb, in Sample G019833; and
- 7.1 g/t Ag, 2.39% Zn, 0.26% Pb, in Sample G019853.
- Extension of Mineralization: 2025 grab samples extend the footprint of polymetallic mineralization in the northeast corner of the Project to over 350 metres in strike length.
- Strategic Location: The Project is located approximately twenty-eight (28) km northwest of Germansen Landing, British Columbia, with favourable carbonate and dolomite breccia host rocks that are prospective for polymetallic mineralization.
Quarry Project Historical Highlights
- Historical samples from the 1990s assayed 0.89 g/t Au, 3.8% Cu, 0.34% Zn, 42.5% Pb, 0.65 g/t Ag, and 20% Sb1.
- Historical grab samples from 1954 yielded assays averaging 83.5% Pb and 1,576 g/t Ag1.
- Historic Silver, Lead, and Zinc Estimates of the Bullseye Zone (NI 43-101 non-compliant):
- 99,781 tonnes @ 1.42% Pb, 2.24% Zn, 36.3 g/t Ag (drill-indicated);2
- 2.72 Mt @ 3.66% Pb + Zn, 36.3 g/t Ag (original category not classified, three zones);2
- Historical block estimate, parameters unknown; and
- Please see paragraph below (Comments on Reliability of Historical Estimate).
“The results from this second phase of sampling at the Project build directly on our initial findings and continue to demonstrate the strength and consistency of the polymetallic system,” said Scott Walters, Chief Executive Officer of Maxus Mining Inc. “We are particularly encouraged by the extension of mineralization along a defined structural trend at the Bullseye Zone, which highlights the growing scale potential at the Project. These outcomes are helping to refine our understanding of the system and will guide the next phase of targeted exploration.”
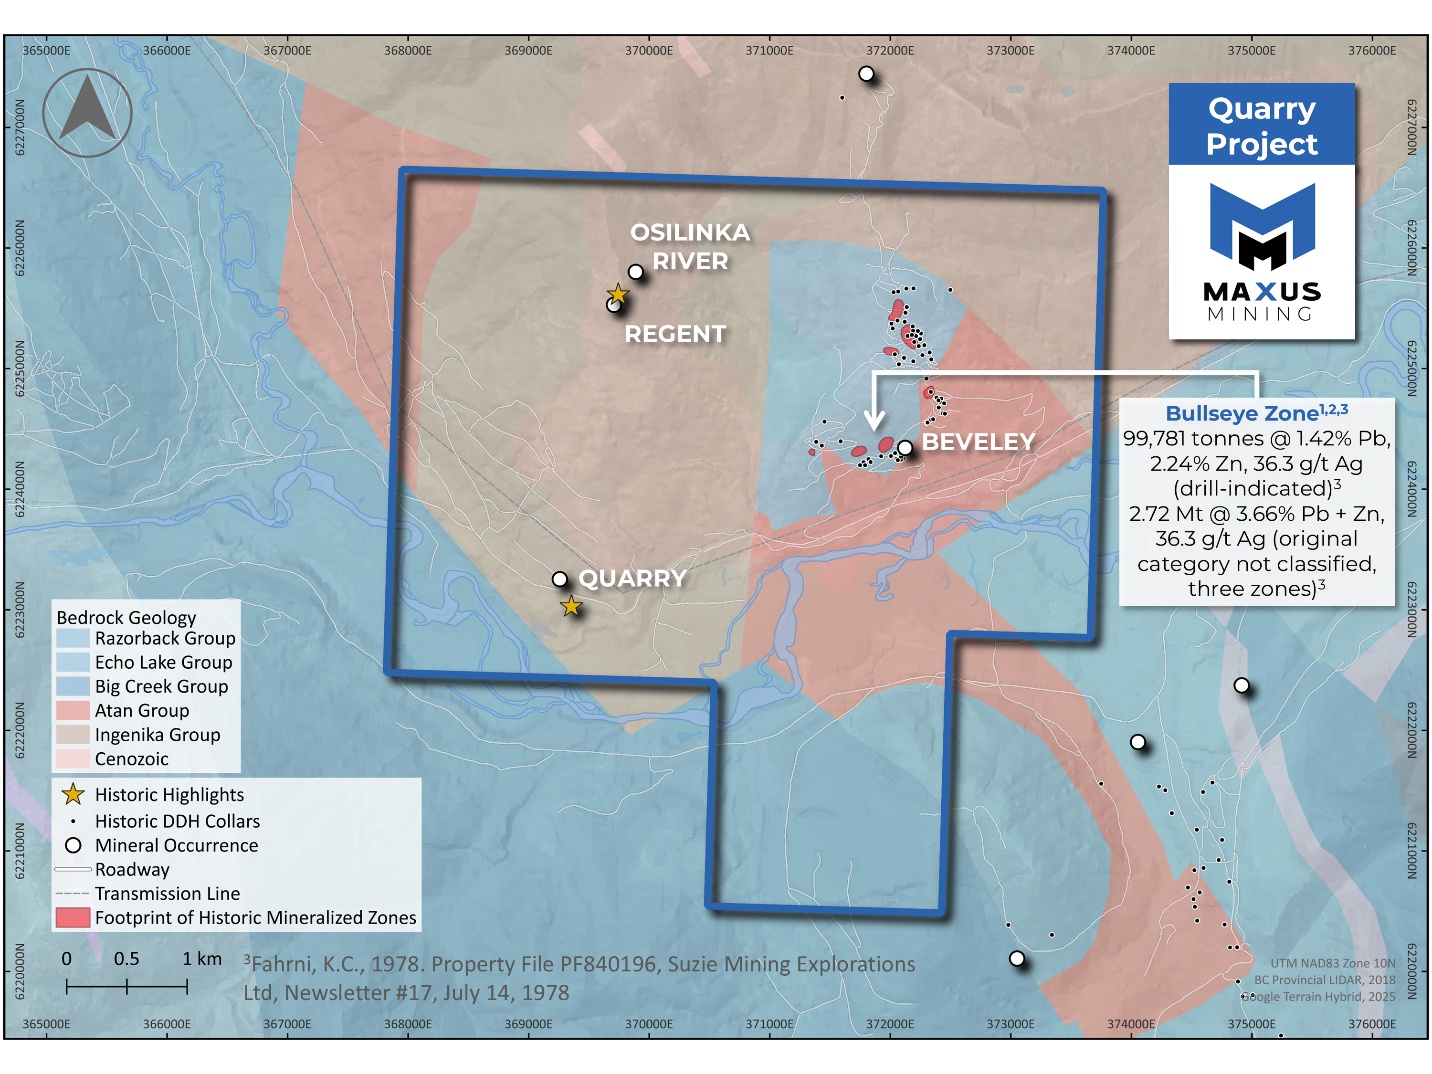
Figure 1: Quarry Project Tenure Map Highlighting the Historic Bullseye Zone
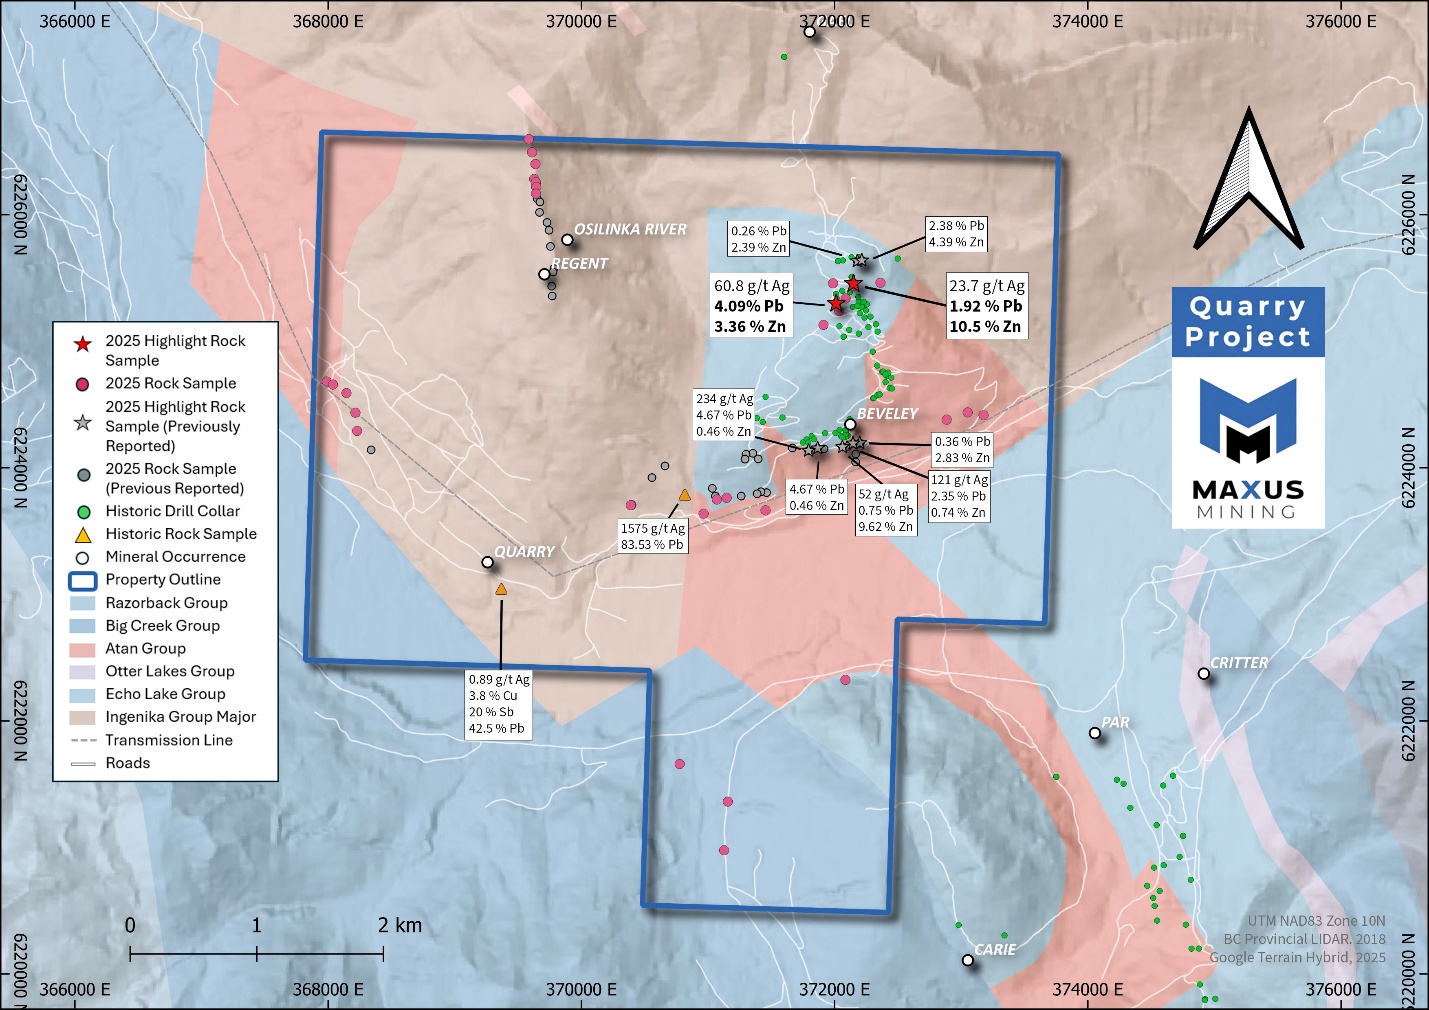
Figure 2: Quarry Antimony Property Outlining Historic Showings, Historic Assays and 2025 Program Highlights
2025 Quarry Exploration Program
Combined assay results from the 2025 Program define two localized and well-developed polymetallic mineralization trends, dominated by silver, lead, and zinc as previously identified at the Property.1,2,3 Of the sixty-five (65) samples, nine (9) samples (comprising 12% of samples) exhibit pronounced multi-element enrichment that clearly stands out from the broader dataset. Table 1 presents selected assay results for samples collected during the Program.
Two highlighted samples reported in this release, G019851 and G019857, were collected in the northeast corner of the Project and returned elevated lead and zinc values, up to 4.09% Pb and 10.5% Zn (Please see Table 1 and Figure 2). These samples extend a NE–SW-trending zone of polymetallic mineralization over 350 m in length (Please see Figure 2). The samples were taken from sandstone outcrop and subcrop along an exposed ridge. The samples displayed common quartz veining, silicification, and base metal mineralization.
Overall, the geochemical results support interpretation of structurally controlled Ag–Pb–Zn ± Sb vein systems, with sharp geochemical contrasts indicating strong structural concentration of metals. These characteristics support the prioritization of detailed structural mapping and targeted sampling along known structural trends, specifically the E–W 450 m shear zone located in the southeast portion of the Property and the NE–SW mineralized trend in the northeast (Please see Figure 2).
Table 1: 2025 Quarry Program Assay Highlights**
| Sample ID | Easting | Northing | Elevation | Au g/t | Ag g/t | Cu ppm | Mo ppm | Pb ppm | Sb ppm | Zn ppm |
| G019802 | 367989 | 6224681 | 941 | 0.00 | 0.5 | 1.8 | 0.8 | 3 | 2 | 9 |
| G019803 | 368037 | 6224657 | 946 | 0.00 | 0.5 | 1.2 | 0.5 | 2 | 2 | 2 |
| G019804 | 368144 | 6224590 | 961 | 0.02 | 0.5 | 5.6 | 0.6 | 4 | 4 | 12 |
| G019805 | 368215 | 6224435 | 934 | 0.00 | 0.5 | 1.7 | 0.6 | 138 | 4 | 13 |
| G019806 | 368228 | 6224291 | 905 | 0.00 | 0.5 | 2.6 | 0.5 | 3 | 2 | 17 |
| G019811 | 370394 | 6223705 | 933 | 0.00 | 0.5 | 8.7 | 1.2 | 8 | 2 | 57 |
| G019812 | 370390 | 6223704 | 933 | 0.01 | 0.5 | 29.3 | 0.7 | 14 | 5 | 261 |
| G019813 | 371454 | 6223663 | 888 | 0.00 | 0.5 | 0.9 | 0.5 | 8 | 2 | 20 |
| G019818 | 371147 | 6223763 | 960 | 0.00 | 0.5 | 0.5 | 0.8 | 2 | 2 | 4 |
| G019821 | 371070 | 6223749 | 963 | 0.17 | 0.5 | 8.1 | 2.4 | 63 | 16 | 47 |
| G019823 | 370965 | 6223637 | 897 | 0.00 | 0.5 | 0.7 | 2.3 | 14 |
The views and opinions expressed herein are the views and opinions of the author and do not necessarily reflect those of Nasdaq, Inc. In This Story
Edit My Quotes
Edit My European Quotes
Your symbols have been updated
You'll now be able to see real-time price and activity for your symbols on the My Quotes of Nasdaq.com.
Edit Watchlist |