
Yield Curve Inversion and Momentum Return
The 2 year / 10 year Treasury yield curve dipped below zero on August 27th. A yield curve measures the difference between yields on two different bond maturities. Normally, investors receive a higher yield for a longer-dated maturity because it is more difficult to forecast the farther you look out into the future. Every once in awhile the reverse happens and the yields on longer-dated maturities are actually lower than those with shorter maturities. This is referred to as an “inversion,” and is considered a predictor of a coming recession.
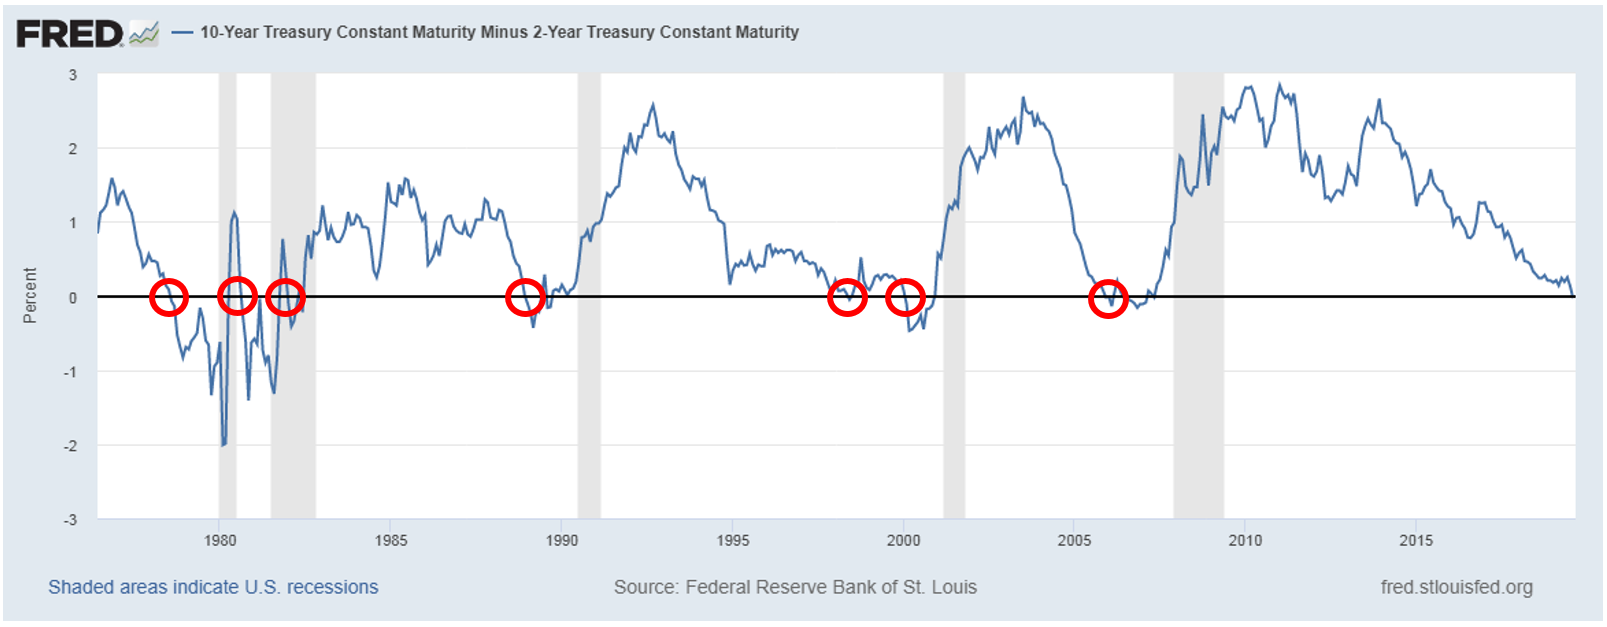
Using the yield curve as a timing tool is difficult. The yield curve has inverted before every recession since the 1970s, but the lead time has varied tremendously. The chart below shows the inversions circled in red. The gray shaded areas on the chart are recessions.
From an investor standpoint, predicting what will happen to stocks is actually more important than predicting when the recession will come. The current yield curve inversion may mean a recession is coming, but should not be a signal for equity investors to panic. In fact, on average, stocks have done very well for 12 and 24 months after the initial inversion. Each inversion is different so it is also informative to look at each one individually.
When the yield curve first dips below zero we mark that date and look at the performance of several indexes over the next 6, 12, 18, and 24 months. We use the S&P 500 Total Return Index for large-cap stocks, the Russell 2000 Total Return Index for small-cap stocks, Barclays Aggregate Bond for fixed income, and two indexes representing high and low momentum stocks. The momentum indexes come from the Ken French Data Library1. We used the, “6 Portfolios Formed on Size and Momentum” series. This series allows us to focus on large and mid-cap stocks so results aren’t skewed by low liquidity stocks. This series is also a conservative measure of momentum because it separates the universe into three momentum buckets instead of the usual 5 or 10.
The table below shows the average forward returns of all of the observations. Twelve months from the first inversion observation the returns are good across the board. Two years after the inversion, the returns are still good, but the rate slows down.

Momentum returns remain strong along with the broad market 12 months forward. The spread between high and low momentum is decent after a year, but unlike the broad indexes, the spread really accelerates during the second year.
Other Topics
Indexes
Nasdaq Dorsey Wright
Nasdaq
Nasdaq Dorsey Wright is a registered investment advisory firm with more than 30 years of expertise is technical analysis, specifically focusing on the steadfast relationship between supply and demand in the markets. Our research and tools help our clients see through the day-to-day clutter of market movements while providing a clear understanding of where market strength lies at all times.
Read Nasdaq Dorsey Wright's Bio
MarketInsite
Nasdaq
Nasdaq’s Marketinsite offers actionable insights on a variety of market-moving topics. Learn from our thought leaders who are driving the capital markets of tomorrow.
Read MarketInsite's Bio