
Tesla (TSLA) has been one of the most searched stocks for some time, and for all of the current interest in artificial intelligence (AI) and in stocks like Nvidia (NVDA), and despite the obvious appeal of the Nasdaq Composite and 100 indices, it remains that way still. That is in part because TSLA is the “people’s stock” with only around 40% institutional ownership, versus over 60% for Apple (AAPL) and well over 70% for “old tech” company like Microsoft (MSFT). But it is also because Tesla is such a compelling story. The stock is volatile in both directions, and its founder, Elon Musk, is rarely out of the headlines, both of which keep interest in its fortunes elevated.
However, while the fate of Twitter, sorry “X”, and the potential for the world’s most nerdy cage match dominate the headlines of articles that contain a mention of Tesla, the most important thing to know about the stock is that it is a relatively boring story of a gradual build to success, and more importantly, domination of an industry.
So when asked, as I often am, “can Tesla regain its highs above $400?” my stock answer is that it is not a question of if it will do so, but simply when. The current circumstances suggest it could be quite soon, despite an uncertain outlook for the economy and therefore the stock market overall.
Tesla has never been a stock that moves in sync with the rest of the market. That is something that is measured by a stock’s correlation coefficient, a number that ranges from -1.0 to +1.0 where +1.0 indicates perfect correlation with the overall market and -1.0, perfect negative correlation, meaning that the stock goes up when the market goes down. TSLA’s correlation coefficient is -0.69, suggesting that generalized economic and market conditions have little or no bearing on the stock’s movement and price. So, even if the fall turns out to be a bit rough for stocks, as it could well be if the Fed keeps raising rates, history suggests that that won’t necessarily impact TSLA.
What will, though, is the inexorable growth of the addressable market in EVs and the fact that, while it may not seem that way sometimes, the transition away from gasoline powered internal combustion engines is still in its early stages. Electric cars will probably account for around 18% of global car sales in 2023, leaving lots of room for continued growth. Despite all of the competition, Tesla remains the best placed company to take advantage of that, with a solid reputation for quality and innovation and, more importantly, the most advanced and widespread charging network.
All of that, of course, constitutes the long-term story that indicates that Tesla will regain the $400 level at some point, but it is the chart that suggests it could do so quite soon…
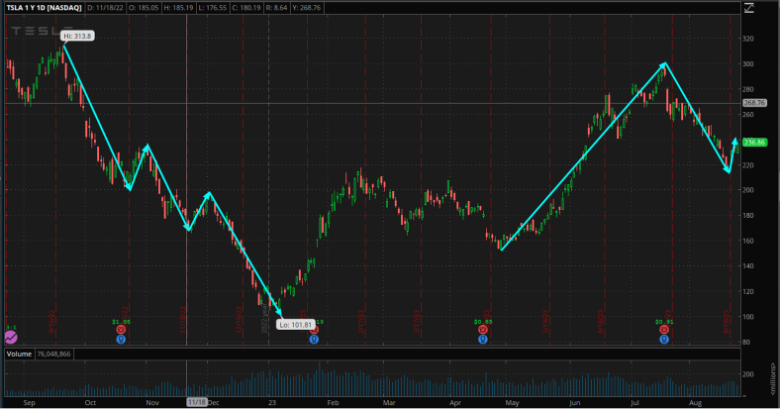
Normally, I dislike fussy charts full of lines and squiggles, but when it comes to TSLA, basic technical patterns are an important part of any analysis. The two-way movement in the past has made it a stock that is popular with traders of all kinds, from private day traders to institutional guys, and, as a result, it tends to do what technical signals suggest more than most. If a lot of people are looking for and reacting to a pattern, that pattern becomes self-fulfilling, and that is where TSLA is right now. There are so many people looking for signals that they are usually quite reliable when they appear.
The zigzag blue line on the left of the chart, for example, shows that on the drop at the end of last year, the stock adhered to an Elliott Wave pattern, with five waves of drops and retracements. It is not a classic pattern, the third, downward wave is too short for that, but it does have the classic Elliott look in some ways, where retracements fuel rather than derail momentum.
Then turn your attention to the right hand side of the chart. What you see there is the beginnings of another Elliott pattern, only in the opposite direction. We have had waves one and two, up then down, and are starting the second upward push from wave three. If that continues, as it most likely will, it will take TSLA back up well over $300, and if $400 isn’t achieved on that wave, it will be on the fifth, after a short retracement in wave four.
This combination of fundamental and technical factors is something I look for in a trade. It is a fascinating story with something for everyone, but more than anything, it is a massive success story that is still in its early stages. If you concentrate on that and ignore all the noise that comes with the stock, this looks like a buy opportunity for both long-term investors and swing traders, whatever happens in the broader market.
The views and opinions expressed herein are the views and opinions of the author and do not necessarily reflect those of Nasdaq, Inc.

Martin Tillier
Martin Tillier spent years working in the Foreign Exchange market, which required an in-depth understanding of both the world’s markets and psychology and techniques of traders. In 2002, Martin left the markets, moved to the U.S., and opened a successful wine store, but the lure of the financial world proved too strong, leading Martin to join a major firm as financial advisor.
Read Martin's Bio