When Performance Matters: Nasdaq-100 vs. S&P 500 Q2, 2023
The Nasdaq-100 and S&P 500 are two of the most popular equity indexes in the US. The Nasdaq-100 is heavily allocated towards top-performing industries such as Technology, Consumer Discretionary, and Health Care, which have helped the Nasdaq-100 outperform the S&P 500 by a wide margin between December 31, 2007, and June 30, 2023. Below is a comparison of annual total returns - which reinvest dividends - between each index. The Nasdaq-100 TR Index has outperformed 11 out of the 15 calendar years in our study, with an underperformance of -14.3% in 2022. This was by far the most significant underperformance observed in our study, driven by global weakness in Growth stocks. However, the Nasdaq-100 bounced back over the first half of 2023, outperforming the S&P 500 by a margin of 22.5% as Technology and Growth-related stocks recovered.
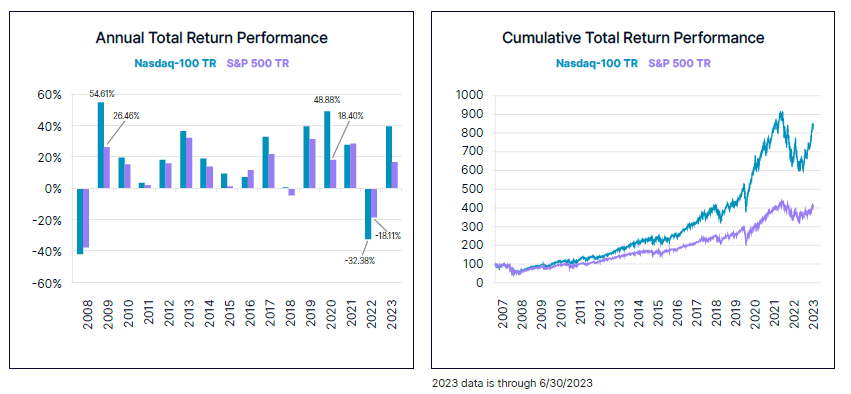
Historical Performance
Despite recent overall market volatility, the Nasdaq-100 TR Index has maintained cumulative total returns of approximately twice that of the S&P500 TR Index.
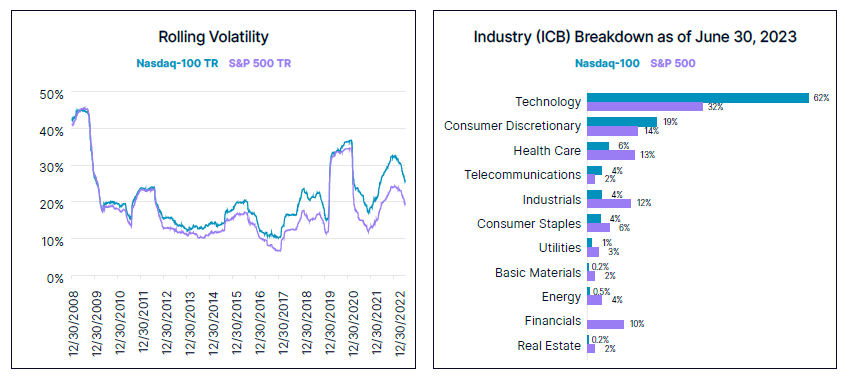
Rolling Volatility (One Year)
One year rolling volatility (calculated by taking the standard deviation of daily returns, annualized) of the Nasdaq-100 has been modestly elevated vs. the S&P 500, averaging only 2.6% higher between December 31, 2007, and June 30, 2023. The overall correlation of daily returns was 93% -- rather impressive given the concentrated exposure of the Nasdaq-100 towards Technology.
Current Industry Weights
We can see important differences in sector exposures between the Nasdaq-100 and the S&P 500 as of June 30, 2023. As mentioned previously, the outsized allocations to both Technology and Consumer Discretionary have helped propel the Nasdaq-100 Index to multiple years of outperformance over the past decade and a half.
Conclusion
The Nasdaq-100 finished the first half of 2023 with a gain of 39.4% compared to the S&P 500’s gain of 16.9%, making this the best start to the year for the tech-heavy Nasdaq-100 since its inception in 1985, continuing the long-running outperformance trend dating back to 2009. The Nasdaq-100 is heavily allocated towards top-performing industries such as Technology, Consumer Discretionary, and Health Care. The long-run growth trend of companies in these industries has persisted in spite of the widespread economic headwinds stemming from the COVID-19 pandemic, geopolitical tensions, and inflation, among other things. It remains generally strong even in the face of interest rate uncertainty. Given the way technology is influencing the world and making companies more efficient, there is a strong possibility that this trend of outperformance will continue into the future, just as we saw over the last six months.
Sources: Nasdaq Indexes, Bloomberg
Disclaimer: Nasdaq® is a registered trademark of Nasdaq, Inc. The information contained above is provided for informational and educational purposes only, and nothing contained herein should be construed as , either on behalf of a particular security or an overall investment strategy. Neither Nasdaq, Inc. nor any of its affiliates makes any recommendation to buy or sell any security or any representation about the financial condition of any company. Statements regarding Nasdaq-listed companies or Nasdaq proprietary indexes are not guarantees of future performance. Actual results may differ materially from those expressed or implied. Past performance is not indicative of future results. Investors should undertake their own due diligence and carefully evaluate companies before investing. ADVICE FROM A SECURITIES PROFESSIONAL IS STRONGLY ADVISED
The views and opinions expressed herein are the views and opinions of the author and do not necessarily reflect those of Nasdaq, Inc.

Nasdaq Index Insights Team
Nasdaq
Nasdaq calculates more than 40,000 diverse indexes, providing coverage across asset classes, countries and sectors.
Read Nasdaq Index Insights Team's Bio