

The Nasdaq-100® and S&P 500 stand as two of the most prominent equity indexes in the United States. With its considerable emphasis on innovative sectors like Technology, Consumer Discretionary, and Health Care, the Nasdaq-100 has consistently outperformed the S&P 500 over the past 16 years (12/31/2007 – 9/30/2024).
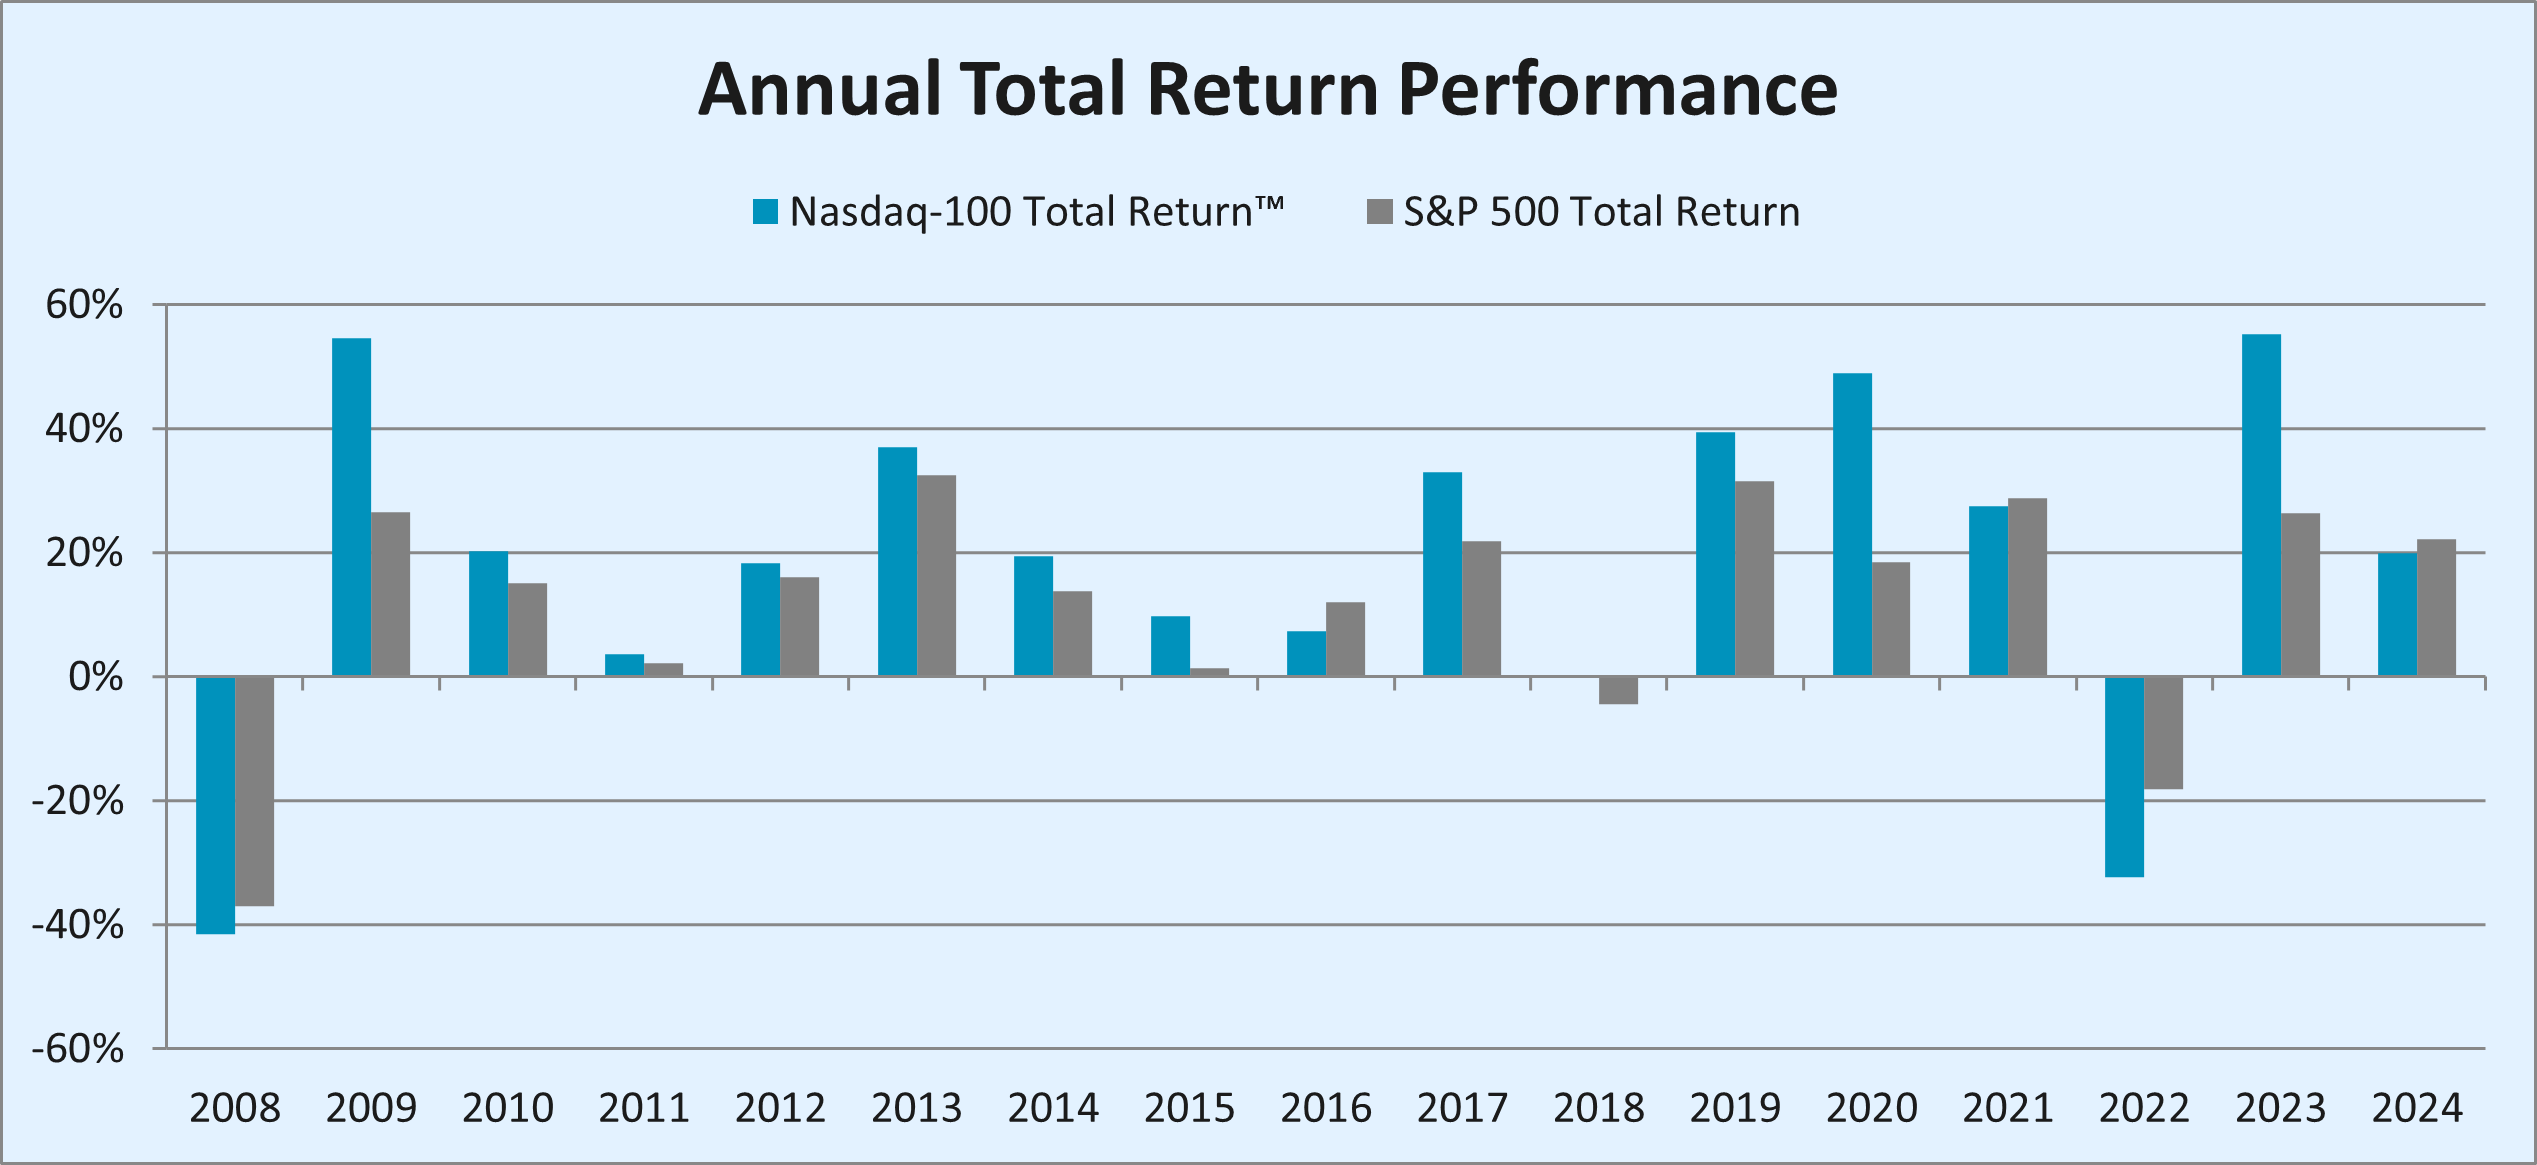
A detailed analysis of their annual total returns, including reinvested dividends, reveals that the Nasdaq-100 Total Return™ Index has exceeded the S&P 500 in 12 out of these 16 calendar years, achieving an impressive average annual return of +18.8. The year 2023 was particularly outstanding for the Nasdaq-100, with a 55% increase—its best calendar year of performance since 1999 and the largest margin of outperformance vs. the S&P 500 since 2020, when it led by more than 30%.
The notable lead of the Nasdaq-100 in 2023 can largely be credited to its substantial allocation to Technology and growth-oriented stocks, especially those focused on Artificial Intelligence (AI). AI-centric companies within the Nasdaq-100 experienced significant advancements and broader adoption of AI solutions across industries, increasing investor interest in AI's transformative capabilities.
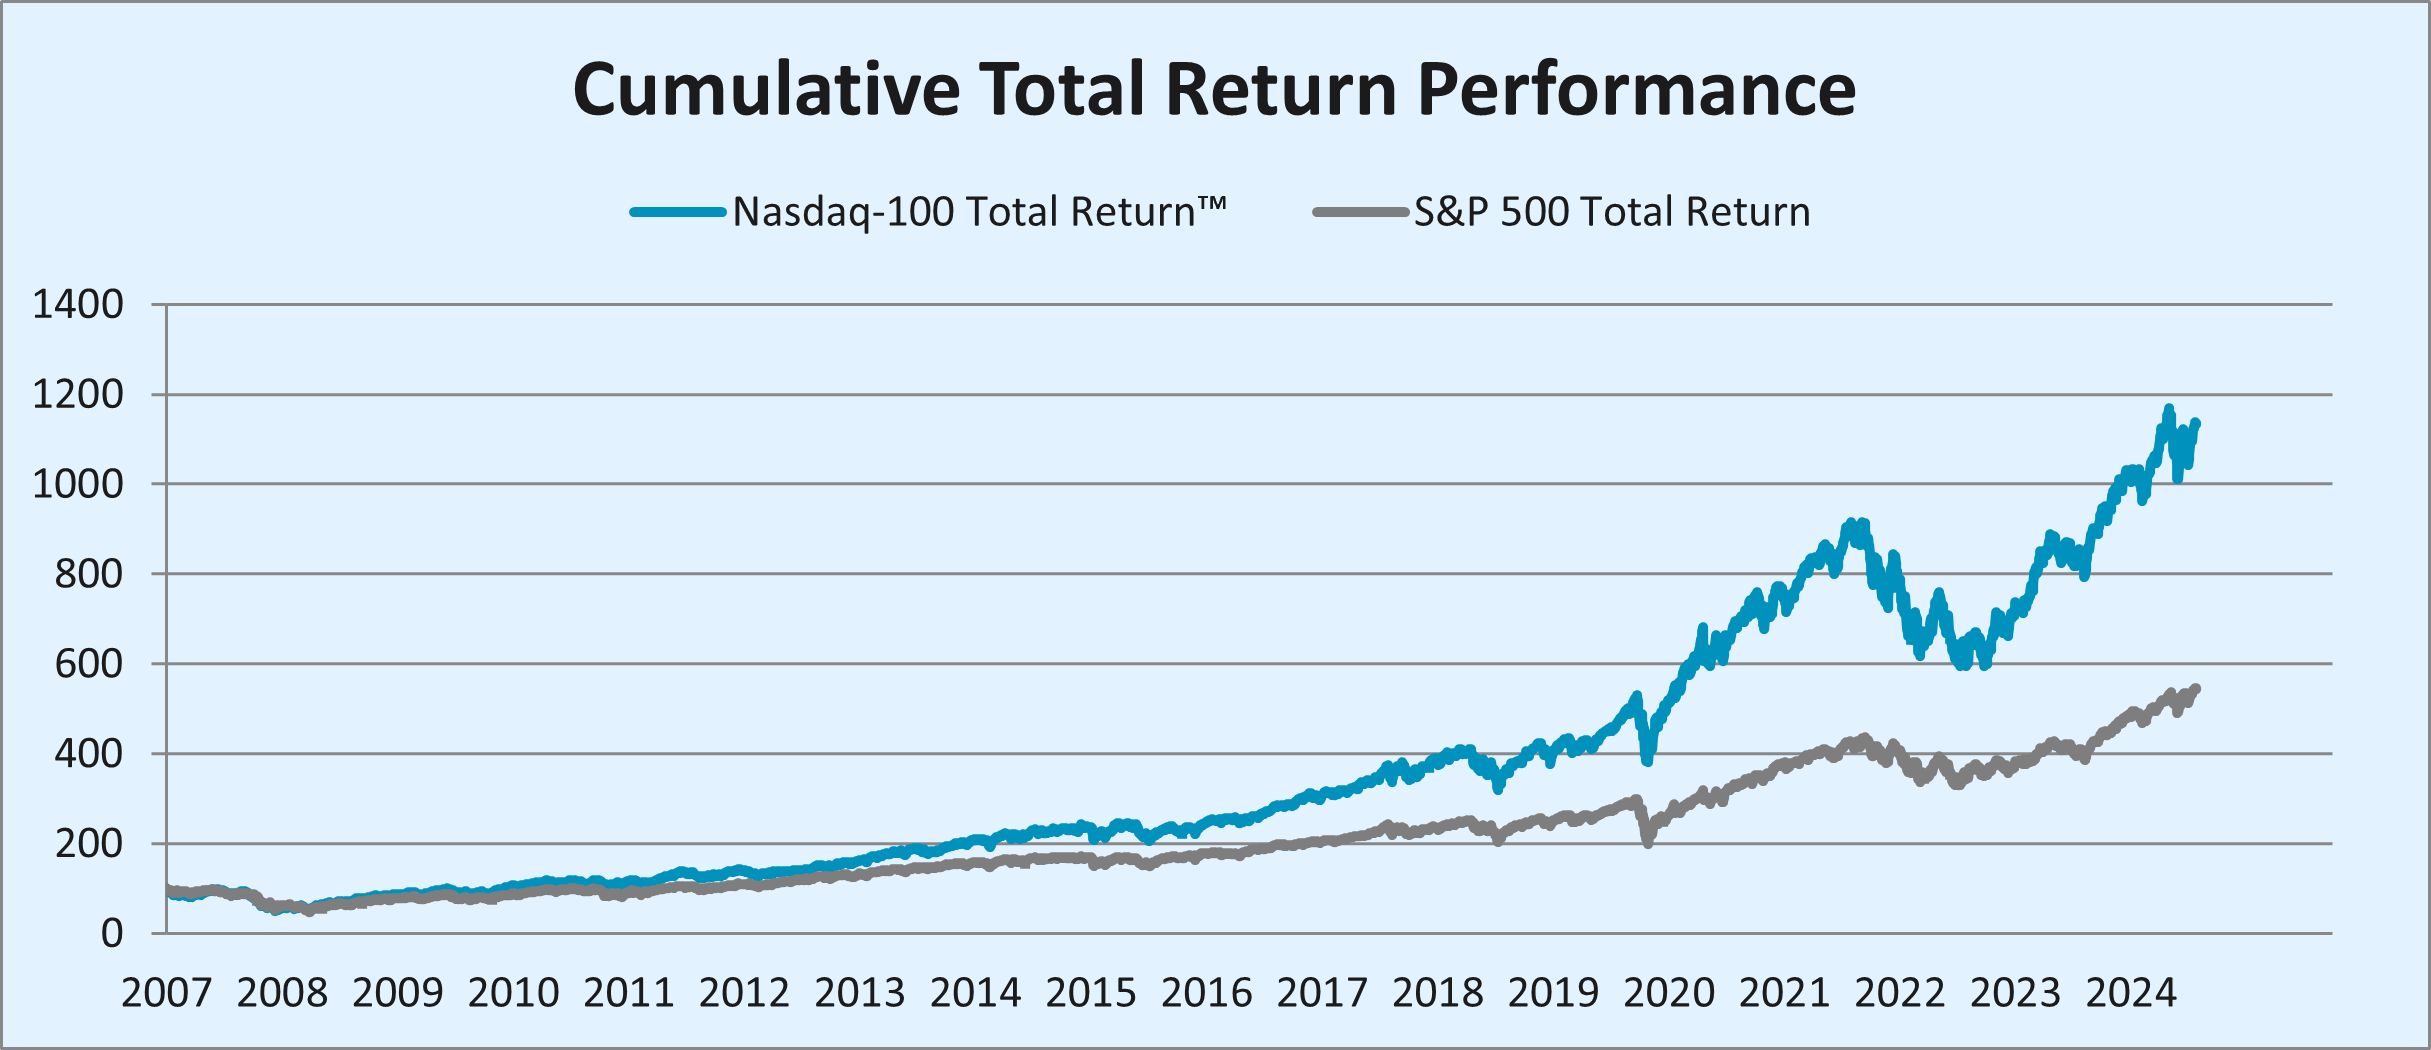
More than halfway through 2024, the Nasdaq-100 slightly trails the S&P 500 year-to-date as of September 30, 2024 (up 19.8% vs. 22.1%). However, the Nasdaq-100 continues to maintain a substantial long-term advantage. Since December 31, 2007, the Nasdaq-100 Total Return™ Index has surged by 1,036%, more than doubling the S&P 500’s total return of 447%.
Historical Performance
Amidst recent market volatility, the Nasdaq-100 Total Return Index has consistently sustained cumulative total returns exceeding twice the performance of the S&P 500 Total Return Index.
| Nasdaq-100 Total Return | S&P 500 Total Return | |
|---|---|---|
| Cumulative Return | 1,036% | 447% |
| Annualized Return | 15.6% | 10.7% |
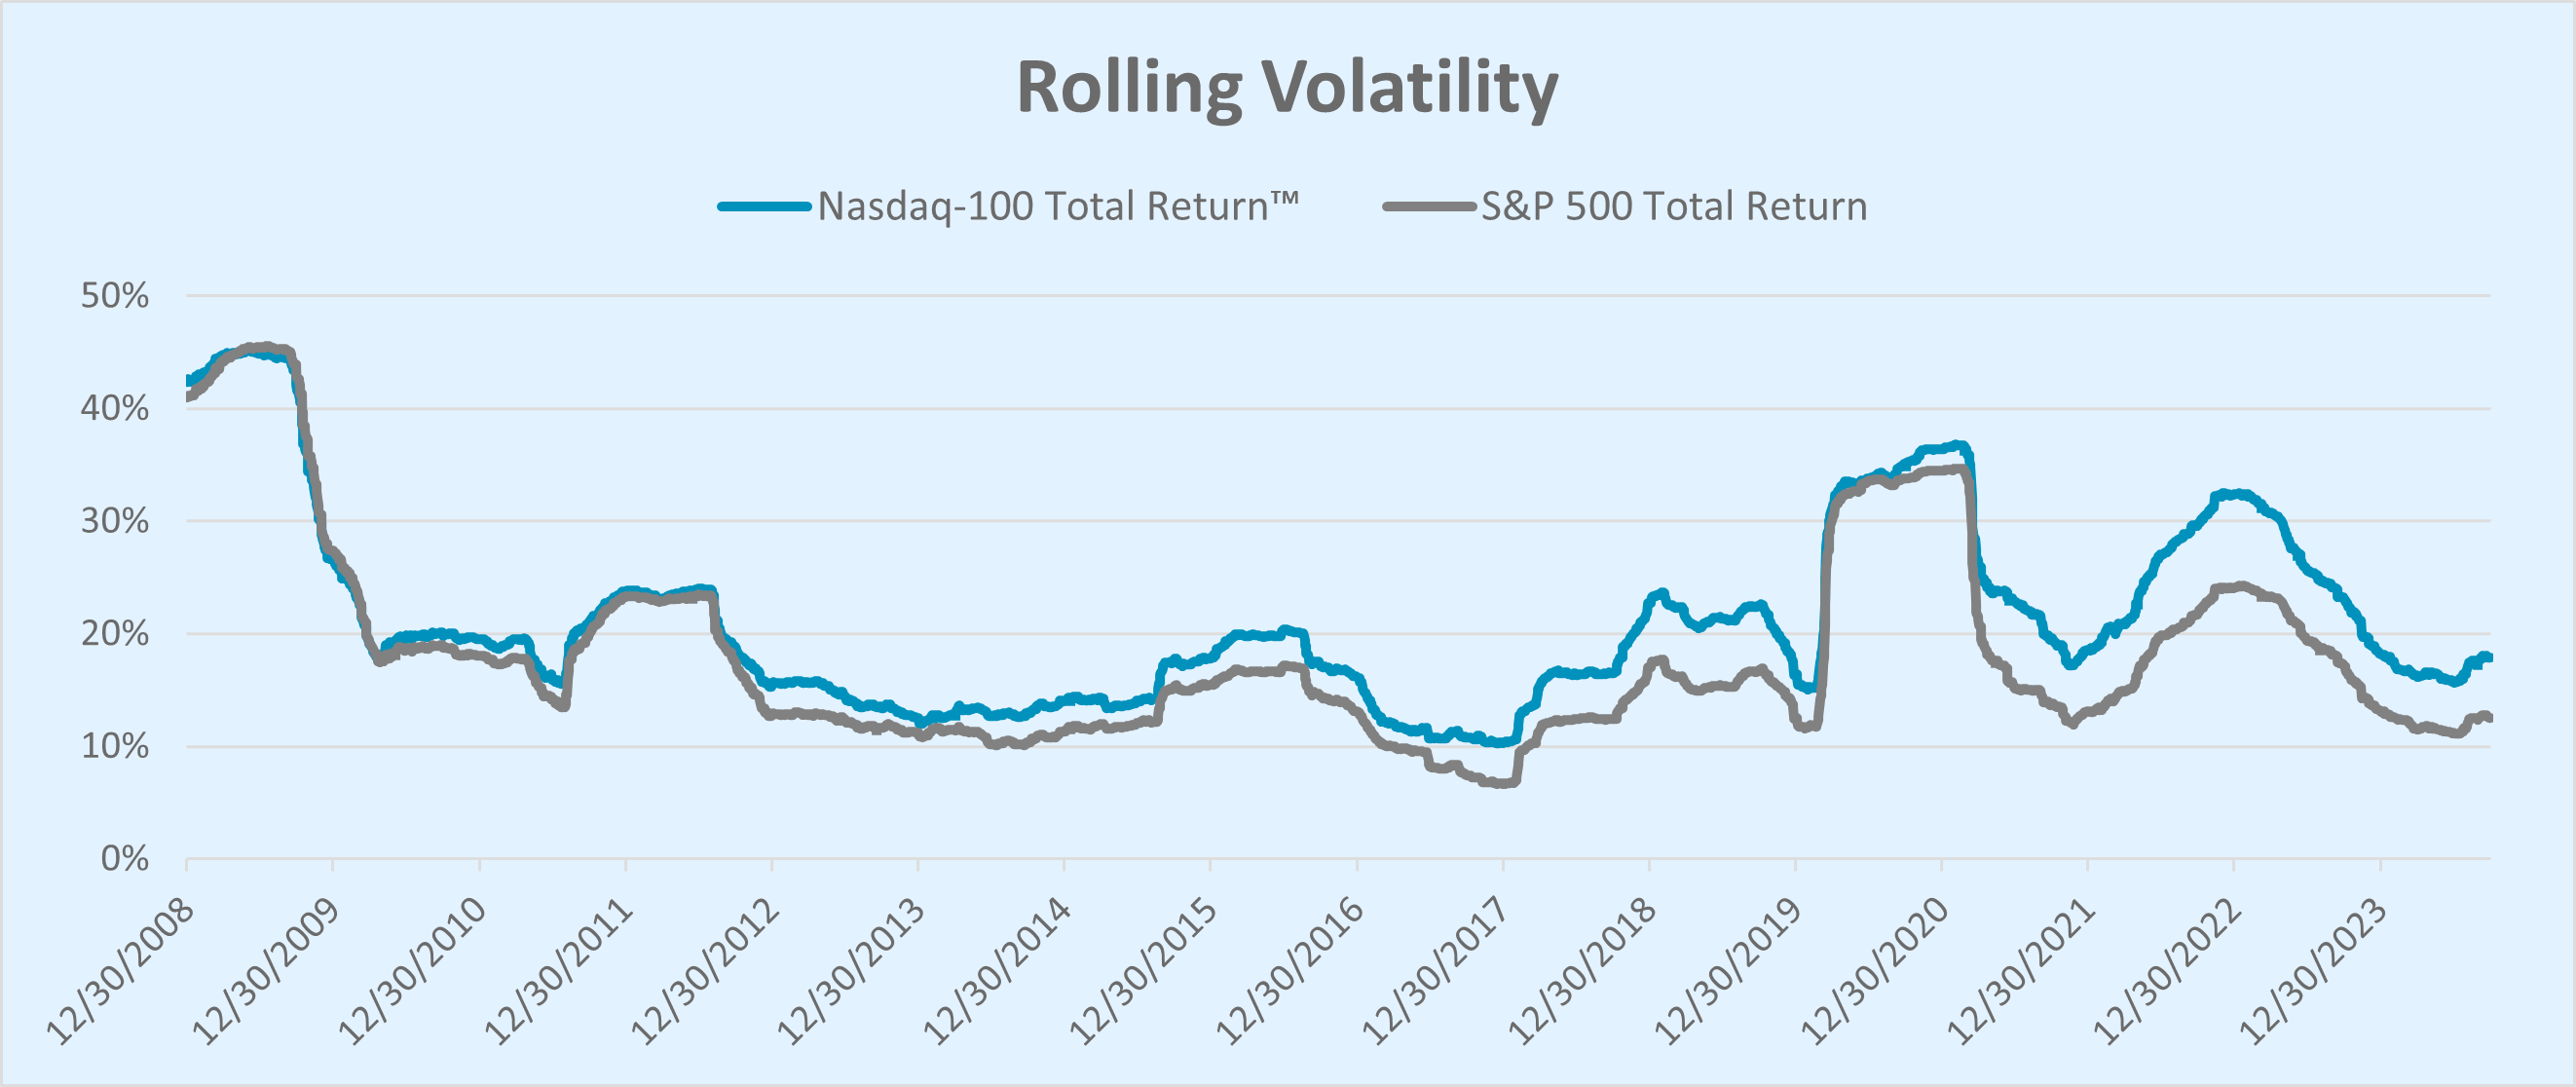
| Annualized Volatility | 23.0% | 20.2% |
Rolling Volatility (One Year)
The one-year rolling volatility, calculated by annualizing the standard deviation of daily returns, has shown a slight elevation in the Nasdaq-100 compared to the S&P 500. On average, it has been just 2.7% higher over the 16-year period spanning from December 31, 2007 to September 30, 2024. What's particularly noteworthy is the overall correlation of daily returns, which is 93%. This level of correlation is impressive, especially considering the Nasdaq-100's heavy concentration in the Technology sector.
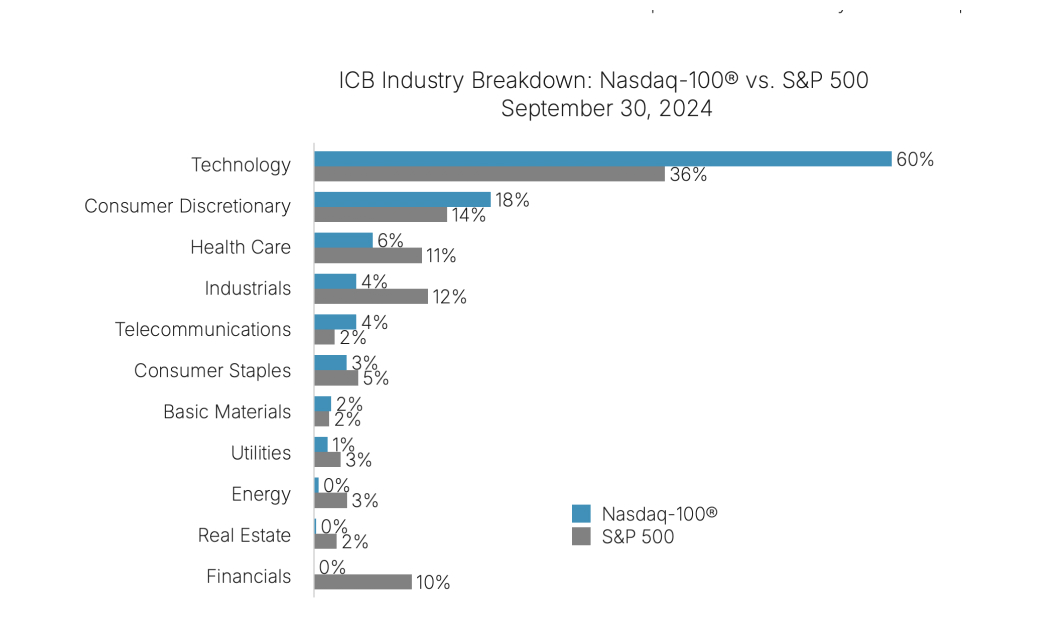
Current Industry Weights
As of September 30, 2024, there are notable disparities in sector allocations between the Nasdaq-100 and the S&P 500. As highlighted earlier, the significant weightings in the Technology and Consumer Discretionary sectors have played a pivotal role in driving the Nasdaq-100 to multiple years of outperformance over the past 16 years. By design, the Nasdaq-100 does not have any Financials exposure.
Conclusion
Despite facing economic challenges such as inflation and shifts in central bank policies against a backdrop of complex geopolitical tensions, the Nasdaq-100 has demonstrated remarkable resilience. The pervasive integration of AI technology, revolutionizing nearly every industry, bolsters the index's capability for continuous innovation and highlights its strong potential for future growth. With its foundational focus on innovation, the Nasdaq-100 is well-positioned to navigate future uncertainties and sustain its long-term growth trajectory.
Sources: Nasdaq Indexes, Bloomberg
Disclaimer:
Nasdaq® is a registered trademark of Nasdaq, Inc. The information contained above is provided for informational and educational purposes only, and nothing contained herein should be construed as investment advice, either on behalf of a particular security or an overall investment strategy. Neither Nasdaq, Inc. nor any of its affiliates makes any recommendation to buy or sell any security or any representation about the financial condition of any company. Statements regarding Nasdaq-listed companies or Nasdaq proprietary indexes are not guarantees of future performance. Actual results may differ materially from those expressed or implied. Past performance is not indicative of future results. Investors should undertake their own due diligence and carefully evaluate companies before investing. ADVICE FROM A SECURITIES PROFESSIONAL IS STRONGLY ADVISED. © 2024. Nasdaq, Inc. All Rights Reserved.
Latest articles

This data feed is not available at this time.
Data is currently not available