
Analysis of short-term trading patterns is not usually a particularly useful tool when it comes to analyzing and anticipating long-term trends. There are plenty of one-day anomalies in any move, up or down, and it is usually a mistake to read too much into them. Sometimes, though, one day’s trading can speak volumes, either by clearly signaling the end of a retracement, or by reinforcing a predictive chart pattern. Yesterday, the S&P 500 futures did both of those things.
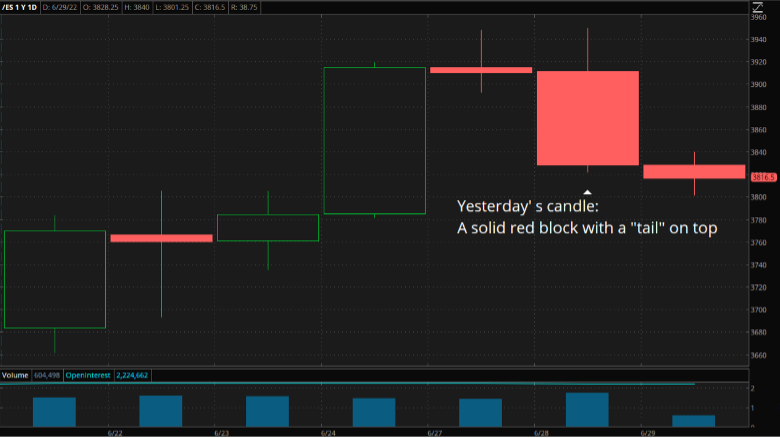
The end of a retracement that had some people asserting, or maybe just hoping, that stocks were going to bounce back strongly was signaled by the shape of the chart candle on the day, as shown in the chart above. It is a long, solid block of red with a tail or wick sticking up out of the top. That suggests an opening and a move higher until a level was hit that prompted sustained selling that persisted into the close. That is a bearish pattern because it suggests that the buyers, who had some success over the preceding week or so, ran out of steam and then retreated when challenged by motivated sellers.
If there had been some news or event that sparked that turnaround yesterday, then it wouldn’t mean much, but there was not. It was a technical move, which some might say makes it less impactful. However, a turnaround like that shows the default mood of the market absent any outside stimuli, and in this case, that mood is distinctly bearish.
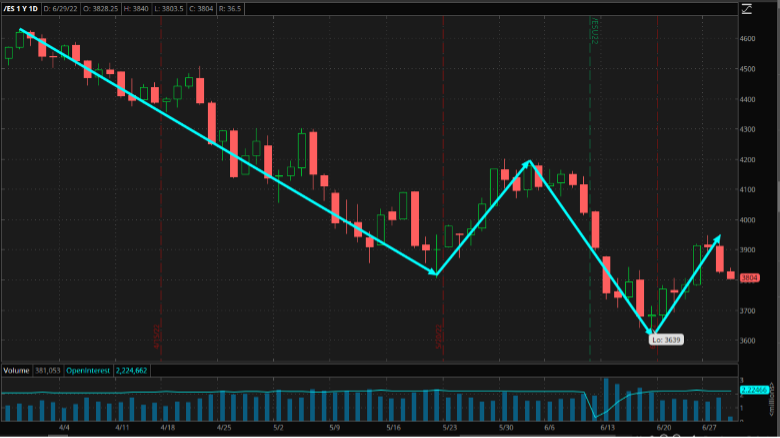
If you pull back and look at the chart more generally over the last three months, the message is the same too. Yesterday’s down day looks right now like it will be the “fifth wave” in an Elliott Wave pattern. The first four are marked on the chart above by the blue arrows, and as you can see, they form a classic Elliott “down, up, down, up,” which Elliott tells us will now be followed by another down, a move that will take the market below the previous low. In this case, that means a drop back below 3,639.
As always with any chart reading, none of this would matter if there were to be positive news about the economy or the Fed’s intentions but, quite honestly, it is very hard to see from where that might come. Jay Powell is speaking to the ECB today and can be expected to hold the party line and say that he sees a recession as unlikely. That, however, isn’t really news. If anything, that could be seen as bad for stocks. A Fed board that is convinced that they won’t cause a recession is far more likely to push too hard in terms of raising rates than one that is aware of a real danger.
At this point, the chart and basic logic suggest another leg lower for stocks. The best, maybe the only hope that doesn’t come about will be tomorrow morning, when the moment’s most watched figure, the Core Personal Consumption Expenditure (PCE) Index, is released. If that were to show that inflation slowed significantly last month, then there would be a big relief rally that would change the entire picture. However, a combination of other data already released, personal experience with purchases, and just plain common sense makes it unlikely that Core PCE will be good news.
It is far more likely that it will tell us very little that we don’t already know, as backward-looking data tend to do. Prices were rising last month, and consumers were beginning to feel the pinch, but traders have already priced that in. So, absent any “news” from the numbers, sentiment will continue to control the market, and the charts, unfortunately, tell us that that sentiment is decidedly negative.
The views and opinions expressed herein are the views and opinions of the author and do not necessarily reflect those of Nasdaq, Inc.

Martin Tillier
Martin Tillier spent years working in the Foreign Exchange market, which required an in-depth understanding of both the world’s markets and psychology and techniques of traders. In 2002, Martin left the markets, moved to the U.S., and opened a successful wine store, but the lure of the financial world proved too strong, leading Martin to join a major firm as financial advisor.
Read Martin's Bio