
SLM (NASDAQ:SLM) is gearing up to announce its quarterly earnings on Thursday, 2025-07-24. Here's a quick overview of what investors should know before the release.
Analysts are estimating that SLM will report an earnings per share (EPS) of $0.52.
SLM bulls will hope to hear the company announce they've not only beaten that estimate, but also to provide positive guidance, or forecasted growth, for the next quarter.
New investors should note that it is sometimes not an earnings beat or miss that most affects the price of a stock, but the guidance (or forecast).
Earnings Track Record
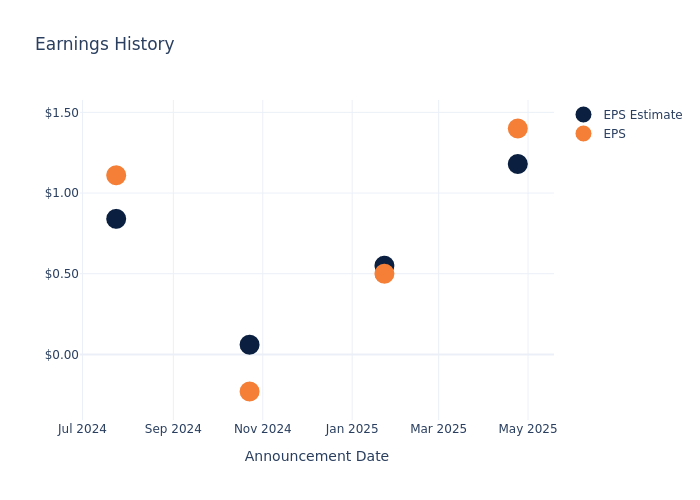
In the previous earnings release, the company beat EPS by $0.22, leading to a 1.39% drop in the share price the following trading session.
Here's a look at SLM's past performance and the resulting price change:
| Quarter | Q1 2025 | Q4 2024 | Q3 2024 | Q2 2024 |
|---|---|---|---|---|
| EPS Estimate | 1.18 | 0.55 | 0.06 | 0.84 |
| EPS Actual | 1.40 | 0.50 | -0.23 | 1.11 |
| Price Change % | -1.0% | -1.0% | -3.0% | -3.0% |
Tracking SLM's Stock Performance
Shares of SLM were trading at $32.76 as of July 22. Over the last 52-week period, shares are up 44.54%. Given that these returns are generally positive, long-term shareholders are likely bullish going into this earnings release.
Analyst Opinions on SLM
For investors, grasping market sentiments and expectations in the industry is vital. This analysis explores the latest insights regarding SLM.
A total of 6 analyst ratings have been received for SLM, with the consensus rating being Outperform. The average one-year price target stands at $37.83, suggesting a potential 15.48% upside.
Understanding Analyst Ratings Among Peers
The below comparison of the analyst ratings and average 1-year price targets of and Dave, three prominent players in the industry, gives insights for their relative performance expectations and market positioning.
- Analysts currently favor an Buy trajectory for Dave, with an average 1-year price target of $234.73, suggesting a potential 616.51% upside.
Peer Analysis Summary
Within the peer analysis summary, vital metrics for and Dave are presented, shedding light on their respective standings within the industry and offering valuable insights into their market positions and comparative performance.
| Company | Consensus | Revenue Growth | Gross Profit | Return on Equity |
|---|---|---|---|---|
| Enova International | Buy | 22.24% | $345.64M | 6.10% |
| Dave | Buy | 46.65% | $100.87M | 15.06% |
Key Takeaway:
SLM ranks higher than peers in Revenue Growth and Gross Profit, indicating strong performance in these areas. However, SLM lags behind in Return on Equity compared to peers. Overall, SLM is positioned in the middle among its peers based on the provided metrics.
Get to Know SLM Better
SLM Corp is an education solutions company. It business is to originate and service loans to students and their families to finance the cost of their education. The provide Private Education Loans to mean education loans to students or their families that are not made, insured, or guaranteed by any state or federal government.
Financial Insights: SLM
Market Capitalization: With restricted market capitalization, the company is positioned below industry averages. This reflects a smaller scale relative to peers.
Revenue Growth: SLM's revenue growth over a period of 3 months has been noteworthy. As of 31 March, 2025, the company achieved a revenue growth rate of approximately 3.54%. This indicates a substantial increase in the company's top-line earnings. When compared to others in the Financials sector, the company faces challenges, achieving a growth rate lower than the average among peers.
Net Margin: SLM's net margin is impressive, surpassing industry averages. With a net margin of 51.73%, the company demonstrates strong profitability and effective cost management.
Return on Equity (ROE): SLM's financial strength is reflected in its exceptional ROE, which exceeds industry averages. With a remarkable ROE of 14.81%, the company showcases efficient use of equity capital and strong financial health.
Return on Assets (ROA): SLM's ROA lags behind industry averages, suggesting challenges in maximizing returns from its assets. With an ROA of 1.02%, the company may face hurdles in achieving optimal financial performance.
Debt Management: SLM's debt-to-equity ratio stands notably higher than the industry average, reaching 2.86. This indicates a heavier reliance on borrowed funds, raising concerns about financial leverage.
To track all earnings releases for SLM visit their earnings calendar on our site.
This article was generated by Benzinga's automated content engine and reviewed by an editor.
Latest Ratings for SLM
| Date | Firm | Action | From | To |
|---|---|---|---|---|
| Jul 2025 | Jefferies | Maintains | Buy | Buy |
| Jul 2025 | JP Morgan | Upgrades | Neutral | Overweight |
| May 2025 | Barclays | Maintains | Overweight | Overweight |
View More Analyst Ratings for SLM
View the Latest Analyst Ratings
© 2025 Benzinga.com. Benzinga does not provide investment advice. All rights reserved.
The views and opinions expressed herein are the views and opinions of the author and do not necessarily reflect those of Nasdaq, Inc.

