
Note: Deckers’ fiscal year ends on March 31.
Deckers Outdoor Corp (NYSE: DECK) is set to report its fiscal first-quarter earnings on Thursday, July 24, 2025. Analysts predict the company will report adjusted earnings of $0.68 per share on $901 million in sales. This would represent an 11% decline in earnings and a 9% growth in sales compared to the previous year’s figures of $0.76 per share and $825 million, respectively. Investors will closely watch the company’s performance amid ongoing challenges, including macro pressures and tariff concerns. Historical data shows that the stock has increased 56% of the time in the one day following earnings announcements, with a median rise of 9.8% and maximum one-day positive returns reaching 19%. Separately, see Is Monarch Casino Stock A Buy?
Deckers delivered mixed fiscal Q4 results—beating earnings estimates but issuing cautious guidance. Core brands HOKA and UGG drove growth, with HOKA up 10% in Q4 and 23.6% for the full year, and UGG rising 3.6% and 13.1%, respectively. Total Q4 revenue rose 6.5% to over $1 billion, while EPS climbed to $1.00 from $0.82. Amid inflation and tariff pressures, management withheld full-year guidance but forecast Q1 sales of $890–$910 million, up 8%–10% year-over-year.
Despite macro headwinds, Deckers shows resilience with potential for stronger growth as conditions improve. The company has $15 Bil in current market capitalization. Revenue over the last twelve months was $5.0 Bil, and it was operationally profitable with $1.2 Bil in operating profits and net income of $966 Mil. While a lot will depend on how results stack up against consensus and expectations, understanding historical patterns might turn the odds in your favor if you are an event-driven trader.
There are two ways to do that: understand the historical odds and position yourself before the earnings release, or look at the correlation between immediate and medium-term returns post-earnings and position yourself accordingly after the earnings are released. That said, if you seek upside with lower volatility than individual stocks, the Trefis High Quality portfolio presents an alternative, having outperformed the S&P 500 and generated returns exceeding 91% since its inception. See earnings reaction history of all stocks.

Image by mantfly from Pixabay
DECK’s Historical Odds Of Positive Post-Earnings Return
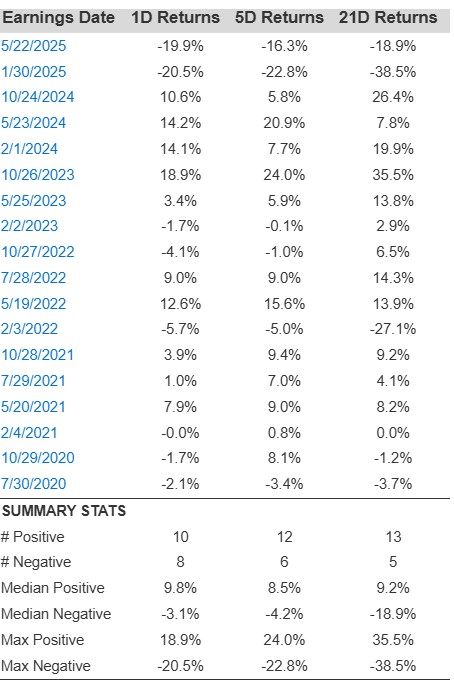
Some observations on one-day (1D) post-earnings returns:
- There are 18 earnings data points recorded over the last five years, with 10 positive and 8 negative one-day (1D) returns observed. In summary, positive 1D returns were seen about 56% of the time.
- Notably, this percentage increases to 60% if we consider data for the last 3 years instead of 5.
- Median of the 10 positive returns = 9.8%, and median of the 8 negative returns = -3.1%
Additional data for observed 5-Day (5D), and 21-Day (21D) returns post earnings are summarized along with the statistics in the table below.
Correlation Between 1D, 5D, and 21D Historical Returns
A relatively less risky strategy (though not useful if the correlation is low) is to understand the correlation between short-term and medium-term returns post earnings, find a pair that has the highest correlation, and execute the appropriate trade. For example, if 1D and 5D show the highest correlation, a trader can position themselves “long” for the next 5 days if 1D post-earnings return is positive. Here is some correlation data based on 5-year and 3-year (more recent) history. Note that the correlation 1D_5D refers to the correlation between 1D post-earnings returns and subsequent 5D returns.
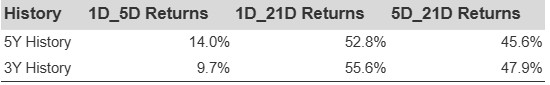
DECK Correlation Between 1D, 5D and 21D Historical Returns
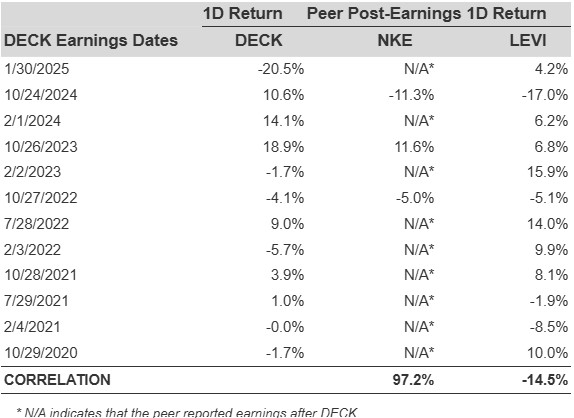
Is There Any Correlation With Peer Earnings?
Sometimes, peer performance can have influence on post-earnings stock reaction. In fact, the pricing-in might begin before the earnings are announced. Here is some historical data on the past post-earnings performance of Deckers Outdoor stock compared with the stock performance of peers that reported earnings just before Deckers Outdoor. For fair comparison, peer stock returns also represent post-earnings one-day (1D) returns.
Learn more about Trefis RV strategy that has outperformed its all-cap stocks benchmark (combination of all 3, the S&P 500, S&P mid-cap, and Russell 2000), to produce strong returns for investors.
Invest with Trefis Market-Beating Portfolios
See all Trefis Price EstimatesThe views and opinions expressed herein are the views and opinions of the author and do not necessarily reflect those of Nasdaq, Inc.

