
Charter Communications (NASDAQ: CHTR) is set to report its fiscal second-quarter earnings on Friday, July 25, 2025. Analysts predict the company will report earnings of $9.70 per share on $13.75 billion in sales. This would represent a 13% growth in earnings and a flat growth in sales compared to the previous year’s figures of $8.59 per share and $13.69 billion, respectively. Historical data shows that the stock has increased 55% of the time in the one day following earnings announcements, with a median rise of 4.8% and maximum one-day positive returns reaching 17%. Separately, see How Crypto Drove Sharplink Gaming Stock Up 50% Last Week?
Charter Communications has struck a $34.5 billion merger deal with Cox Communications, uniting two major cable operators to better compete against streaming and wireless rivals. Announced on May 16, 2025, the deal is expected to close by mid-2026, pending regulatory and shareholder approval, with a deadline set for May 16, 2026, and possible extensions through 2027. While a lot will depend on how results stack up against consensus and expectations, understanding historical patterns might turn the odds in your favor if you are an event-driven trader.
There are two ways to do that: understand the historical odds and position yourself before the earnings release, or look at the correlation between immediate and medium-term returns post-earnings and position yourself accordingly after the earnings are released. That said, if you seek upside with lower volatility than individual stocks, the Trefis High Quality portfolio presents an alternative, having outperformed the S&P 500 and generated returns exceeding 91% since its inception. See earnings reaction history of all stocks.

Image by Ahmad Ardity from Pixabay
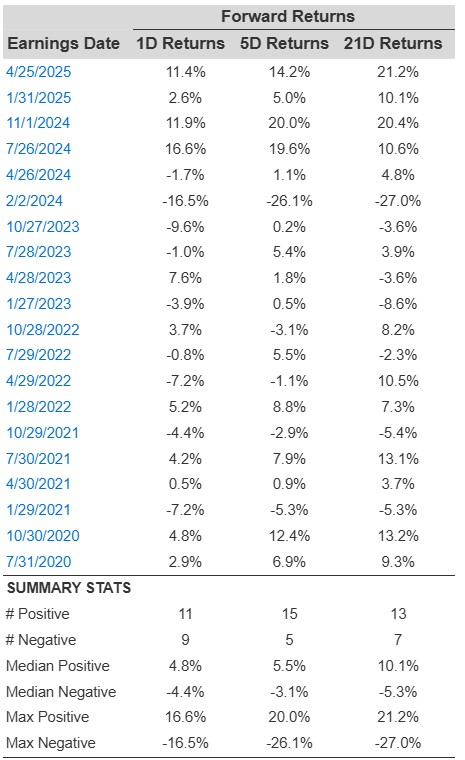
Charter Communications’ Historical Odds Of Positive Post-Earnings Return
Some observations on one-day (1D) post-earnings returns:
- There are 20 earnings data points recorded over the last five years, with 11 positive and 9 negative one-day (1D) returns observed. In summary, positive 1D returns were seen about 55% of the time.
- However, this percentage decreases to 50% if we consider data for the last 3 years instead of 5.
- Median of the 11 positive returns = 4.8%, and median of the 9 negative returns = -4.4%
Additional data for observed 5-Day (5D), and 21-Day (21D) returns post earnings are summarized along with the statistics in the table below.
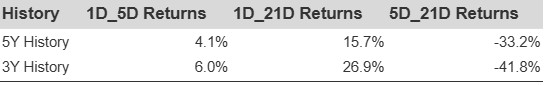
Correlation Between 1D, 5D, and 21D Historical Returns
A relatively less risky strategy (though not useful if the correlation is low) is to understand the correlation between short-term and medium-term returns post earnings, find a pair that has the highest correlation, and execute the appropriate trade. For example, if 1D and 5D show the highest correlation, a trader can position themselves “long” for the next 5 days if 1D post-earnings return is positive. Here is some correlation data based on 5-year and 3-year (more recent) history. Note that the correlation 1D_5D refers to the correlation between 1D post-earnings returns and subsequent 5D returns.
Learn more about Trefis RV strategy that has outperformed its all-cap stocks benchmark (combination of all 3, the S&P 500, S&P mid-cap, and Russell 2000), to produce strong returns for investors.
Invest with Trefis Market-Beating Portfolios
See all Trefis Price EstimatesThe views and opinions expressed herein are the views and opinions of the author and do not necessarily reflect those of Nasdaq, Inc.

