The value vs. growth stocks debate is never-ending, and 2021 provided a near-perfect illustration of how regularly these equity styles ebb and flow. Value stocks, as defined here by the iShares S&P 500 Value ETF (IVE), steadily outperformed growth for the first half of 2021. But in the back half of the year, growth (IVW) outpaced value and finished 2021 8.7 points higher than its value-oriented counterpart.

And again, the tables are turning just one month into 2022, as growth stocks are experiencing their largest drawdown since March 2020. IVW’s 14.1% retreat from its all-time high is also nearly 3x that of IVE’s amid equities’ broader pullback:

The jostling for outperformance between the two equity styles has brought an age-old question back to the forefront: which are better positioned, value or growth stocks?
Value & Growth Securities Through the Years
Value and growth have each outperformed the other over certain time periods—the chart below shows the rolling three-year total return for the Russell 1000 Growth and Russell 1000 Value indices since the early 1980s, with value and growth regularly trading the lead. The lower panel illustrates the spread between the two, with a value above zero representing growth outperforming value.

It’s easy to get carried away when one approach significantly outpaces the other, but when deciding between value and growth investing, it’s important to consider cyclicality, as well as your personal investment objectives and time horizon. To help in your decision-making, we’ve outlined below the most important characteristics of each, how value and growth compare in terms of performance, and several ways YCharts helps uncover the best strategy for you and your clients.
The Top Growth & Value Stocks

The Top Growth Stocks table is based on YCharts’ “Trailing Revenue, EPS, and CF Growth”, narrowed to constituents of the S&P 500 Growth index. The result is a list of growth stocks with positive Revenue Growth, Diluted EPS Growth, and Cash from Operations Growth on a quarterly, annual, and 3-year basis. To arrive at the top 10, a Scoring Model that equally weighted all growth metrics was applied.
• Nucor (NUE)
• Freeport-McMoRan (FCX)
• Bio-Rad Laboratories (BIO)
• Raymond James Financial (RJF)
• EPAM Systems (EPAM)
• Fortinet Inc (FTNT)
• Lam Research (LRCX)
• Weyerhaeuser (WY)
• NVIDIA (NVDA)
• Intuit (INTU)

Similarly, the Top Value Stocks table comes directly from YCharts’ “Benjamin Graham Value Stocks” template and uses his principles to dial into the most attractive value stocks. The template filters for stocks with over $500M of annual revenue, current assets above twice their current liabilities, total long-term debt less than current assets minus total liabilities, Diluted EPS 10-Year Growth above 2.9, PE 5 less than 20.0, and a Price-to-Book less than 2.0.
• PC Connection (CNXN)
• America’s Car-Mart (CRMT)
• Johnson Outdoors (JOUT)
• Lennar (LEN)
• Miller Industries (MLR)
• Meritage Homes (MTH)
• Safety Insurance Group Inc (SAFT)
• Seneca Foods Corp (SENEA)
• Toll Brothers (TOL)
• The Travelers Companies Inc (TRV)
The Top Growth & Value ETFs

The datatable above utilizes YCharts’ “Best Performing Growth ETFs” template, which screens for all ETFs that align with the growth equity style, an expense ratio less than 0.50, and Total NAV Returns category Rank less than 50 for the past 1-year, 3-year, and 5-year period.
• iShares Morningstar Growth ETF (ILCG)
• iShares Core S&P US Growth ETF (IUSG)
• iShares S&P 500 Growth ETF (IVW)
• iShares Russell 1000 Growth ETF (IWF)
• iShares Russell Top 200 Growth ETF (IWY)
• Vanguard Mega Cap Growth ETF (MGK)
• Nuveen ESG Large-Cap Growth ETF (NULG)
• Invesco QQQ Trust (QQQ)
• Schwab US Large-Cap Growth (SCHG)
• Invesco S&P 500 GARP ETF (SPGP)
• SPDR Portfolio S&P 500 Growth ETF (SPYG)
• Vanguard Russell 1000 Growth ETF (VONG)
• Vanguard S&P 500 Growth ETF (VOOG)
• Vanguard Growth ETF (VUG)
• Etho Climate Leadership US ETF (ETHO)
• iShares Morningstar Mid-Cap Growth ETF (IMCG)
• Nuveen ESG Mid-Cap Growth ETF (NUMG)
• Vanguard Mid-Cap Growth ETF (VOT)
• Invesco S&P Mid-Cap Momentum ETF (XMMO)

The ETFs above were identified using the same criteria as noted above but for all ETFs along the value equity style with category rankings below 25 using the “Best Performing Value ETFs” YCharts template.
• VictoryShares US EQ Inc Enh Vol Wtd ETF (CDC)
• Pacer US Cash Cows 100 ETF (COWZ)
• Schwab Fundamental US Large Company ETF (FNDX)
• Invesco S&P 500 Revenue ETF (RWL)
• Scwab US Dividen Equity ETF (SCHD)
• SPDR Russell 1000 Yield Focus ETF (ONEY)
• Principal Value ETF (PY)
• Invesco S&P MidCap 400® Pure Value ETF (RFV)
• Invesco S&P SmallCap Value with Mom ETF (XSVM)
Value and Growth Defined
Value investors try to identify companies with solid fundamentals which they believe are undervalued by the market. Alternatively, growth investors look for companies that demonstrate rapid revenue growth but have yet to reach scale or their full growth potential. It’s difficult to say which approach is superior because market conditions fluctuate, as do sector returns.
Key Characteristics of Value Stocks
Undervalued compared to their peers: Value stocks trade at lower valuations than other companies in their sector or industry. When share prices fall but a company’s underlying fundamentals remain strong, value stocks become “affordable” in the short-term and hopefully lead to long-term gains.
Lower P/E Ratios than the broad market: Even beyond a company’s closest competitors, value stocks are generally lower-priced than the broader market in terms of price-to-earnings (P/E) ratio, especially compared to growth stocks.
Less growth but reliable income streams: Usually larger and more established businesses, earnings of value stocks grow at modest but consistent clips. Because of their sizes, many companies opt to pay significant amounts of earnings directly to shareholders in the form of dividends, rather than reinvest them back into the business.
Less volatile than the broad market: Because value stocks are priced more conservatively, share prices often move less than the market average, and expectations are lower when companies report earnings. But the trade-off to price stability may be a longer holding period until payout, so value stocks are well-suited for long-term investors.
Key Characteristics of Growth Stocks
Track record of earnings and revenue growth: Growth stocks are typically less mature but have grown their revenue and earnings at a better-than-average rate in recent years, and are expected to continue doing so. Often, growth companies will ignore profitability to continue pushing revenue results. Consistently high growth rates for key top and bottom-line metrics justify their relatively higher valuations.
Higher P/E Ratios than the broad market: Because investors expect their earnings to continue growing, growth stocks carry high valuations such as above-average P/E, price-to-book (P/B), and price-to-sales (P/S) ratios. A strong Forward P/E, which considers estimates made by the company and Wall Street analysts, indicates an expectation of continued growth for these companies.
More growth with less reliable return on investment: Growth companies typically opt to reinvest earnings instead of paying dividends to shareholders. This makes an investor’s ROI dependent on the share price increasing, but when a growth stock plows earnings back into the business, it increases the likelihood of capital appreciation.
More volatile than the broad market: Due to their higher valuations, prices of growth stocks tend to be more volatile than the broader market average. When share prices are already lofty, they can plummet quickly if a company misses expectations, or when negative news, like a key employee departure, surfaces.
In addition to value vs. growth, investors also need to consider whether to use stocks or funds to implement these strategies. Mutual funds and ETFs offer broad exposure to value and growth strategies, capturing many companies that fit the bill, but also others that don’t. And stock pickers may be able to identify the single best value or growth company in the market, but also might choose incorrectly.
Performance of Value vs Growth Stocks
Investors are curious about which strategy generates more returns. While the two strategies historically have their fair shares of ups and downs, the returns table below shows that growth has handily outperformed value since 2012.

Market cyclicality is an important factor to consider when comparing value vs. growth performance.
Growth stocks generally perform better during bull markets, when interest rates are falling, and when corporate earnings are trending up. However, during economic slowdowns, growth tends to lag behind value. Similarly, value tends to outperform growth during a bear market or economic recession, as well as in the early stages of an economic recovery.
Take for instance the recent fall and rise in long-term treasury bond rates. As interest rates rise and future cash flows are increasingly discounted, investors are likely rotating out of growth stocks and into less risky or speculative assets, such as value stocks and fixed income.

Download Visual | Modify in YCharts
Company size (given by market capitalization) is also often a contributing factor. When further breaking down value and growth companies by size, such as large, mid, and small market capitalizations, more nuanced performance differences appear. There are over 77,000 funds available in YCharts, including some popular value and growth ETFs with strategies that incorporate market cap:
Large-cap funds:
Invesco Dynamic Large Cap Value ETF (PWV) and Growth ETF (PWB)
Nuveen ESG Large-Cap Value ETF (NULV) and Growth ETF (NULG)
Schwab US Large-Cap Value ETF (SCHV) and Growth ETF (SCHG)
Mid-cap funds:
iShares Morningstar Mid-Cap Value ETF (IWS) and Growth ETF (IWP)
Nuveen ESG Mid-Cap Value ETF (NUMV) and Growth ETF (NUMG)
Vanguard Mid-Cap Value ETF (VOE) and Growth ETF (VOT)
Small-cap funds:
Opus Small Cap Value Plus ETF (OSCV)
Vanguard Small-Cap Value ETF (VBR) and Growth ETF (VBK)
Using YCharts to Compare Value and Growth Stocks
YCharts features several tools and data sets to enable more informed comparisons of value vs. growth stocks or value funds vs. growth funds:
Create Value vs. Growth Stock Visuals
The charts above illustrate long-term performance for value and growth strategies, but what about individual stocks and the metrics that define them? Use Fundamental Charts to compare two companies based on underlying metrics that define value and growth opportunities, and over any time period. For example, put the P/E, P/S, and price-to-free cash flow ratios for Alphabet (GOOG) and Procter & Gamble (PG), two common top holdings in growth and value funds, respectively, head-to-head.

Generate Side-by-Side Comparison Reports
To compare growth and value funds in a client-friendly format, build a Side-by-Side Comparison report.
The example below pits two growth ETFs, Invesco’s Dynamic Large Cap Growth ETF (PWB) and Nuveen’s ESG Large-Cap Growth ETF (NULG) head-to-head on factors like holdings, performance, risk, and fees. Sending over a comparison report between the two funds can be accomplished in just a few mouse clicks, saving you time while ensuring your client gets the information they need swiftly.
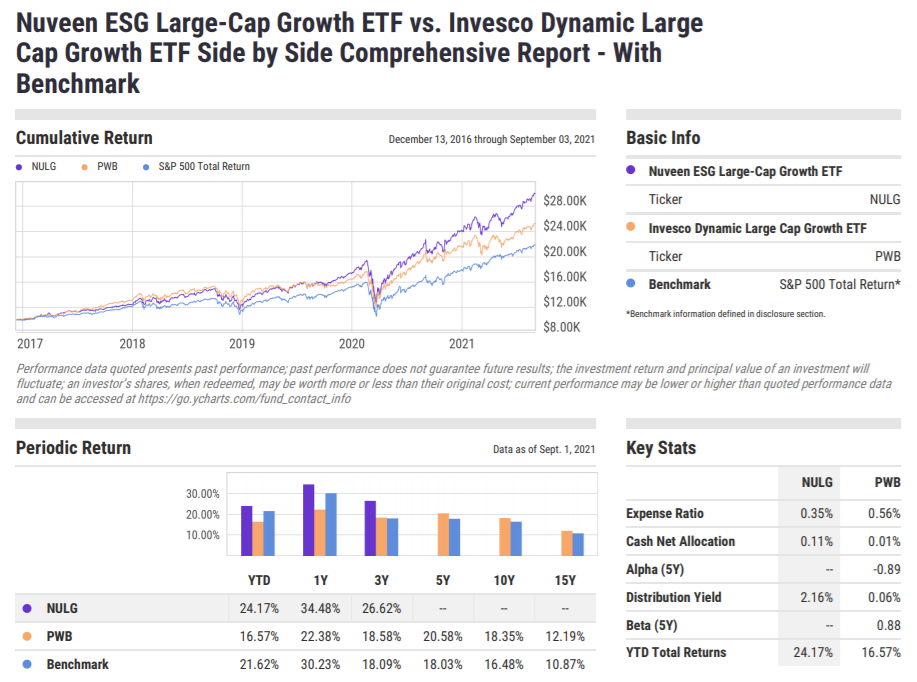
As you can see, Nuveen’s Growth ETF has routed Invesco’s year-to-date, 1-Year, and 3-Year total returns all at a lower expense ratio. These quick and easy to generate comparison reports, provide a world of value for investors and their clients, ensuring visually appealing and straightforward analysis with an immediate impact.
Screen for Value and Growth Stocks, Funds & ETFs
Whether your mind is already made up on value vs. growth, or you want to dig a little deeper, the YCharts Stock and Fund Screeners narrow in on the best equities and funds for your portfolio. The YCharts Screeners feature several pre-built templates to make finding new investment opportunities even easier.
The Trailing Revenue, EPS, and Cash Flow Growth screen, one of many growth-focused Stock Screener templates, finds stocks with strong revenue growth, earnings-per-share (EPS) growth, and cash from operations growth over several timeframes. Other pre-built templates include the growth-focused Forecasted Growth Screen, and Relative Value Stocksand Dividend Growth Over Time for value-minded investors.
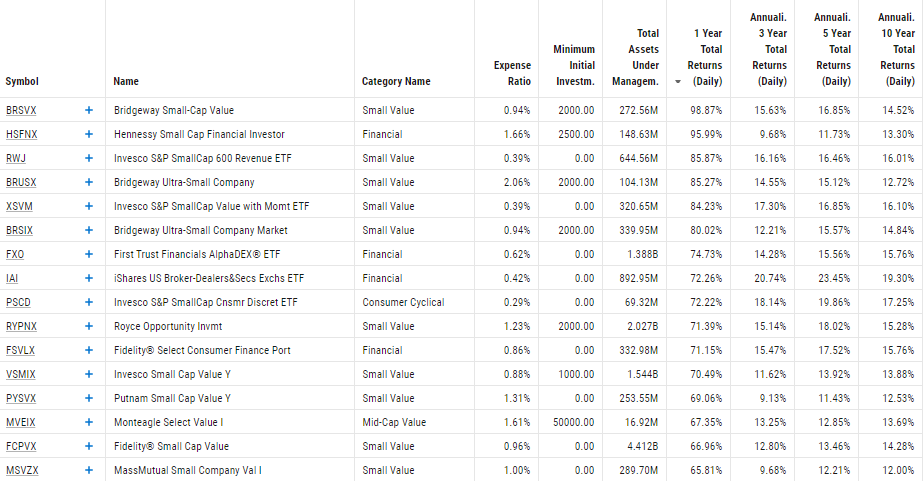
Evaluating value and growth mutual funds and ETFs is a slightly different analysis. With all fund managers trying to pick the best stocks, you can compare and contrast managers’ success by looking at those funds’ performance and risk metrics. Templates like Top Growth Funds and Top Value Funds help identify the best-performing funds of both styles:
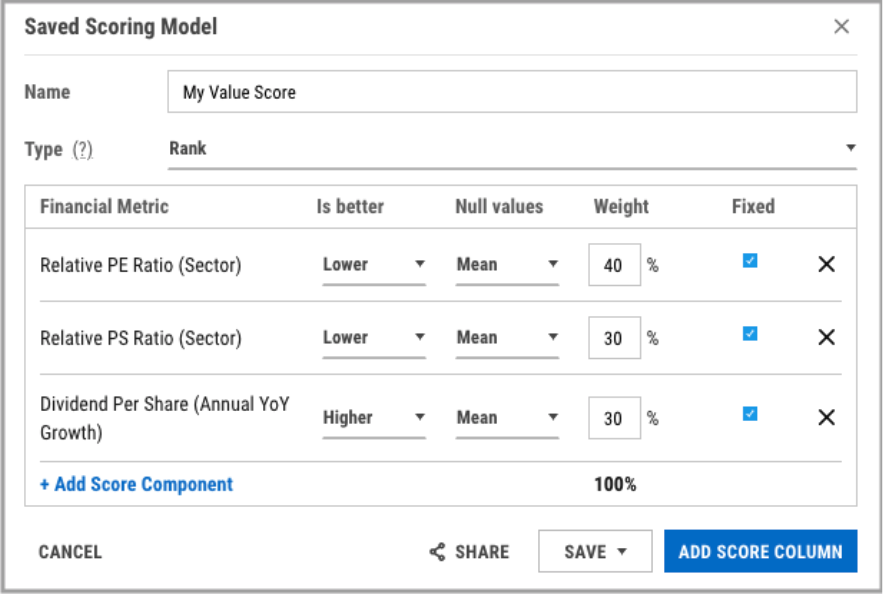
Build Custom Scoring Models for Value and Growth Stocks
Once you have a more manageable list of securities (like the results from a screen above), use Scoring Models to create a custom score or ranking using the metrics you find most important. For example, the Value Score below incorporates relative P/E ratio, relative P/S and dividend per share growth, at varying weights, to compare several value stocks against each other.
Illustrate Risk vs. Reward with Scatter Plot
Looking for a more visual tool to conduct security analysis? Go beyond data tables using Scatter Plot to paint a pros vs. cons picture for a group of securities. The example below shows the risk and reward for the last five years of the top individual Value and Growth holdings:

Value vs Growth: Which Is Better For You?
Your preference for, or belief in, value vs. growth typically comes down to your investment objectives, risk tolerance, and time horizon. You may also prefer to achieve exposure to growth, value, or both via mutual funds and ETFs, or individual stocks.
Some general rules of thumb: growth may be right for you if you’re comfortable with larger price movements and you don’t need current income (by way of dividends), while you might prefer value if you’re looking for more stable investments that regularly pay dividends.
There’s also a case to be made for including both value and growth in your portfolio to smooth out times of volatility, and still keep pace when the market starts to run. “Blend” funds, created by asset managers, have emerged to achieve “growth at a reasonable price.” This hybrid approach focuses on companies poised for growth but still incorporates traditional value.
The views and opinions expressed herein are the views and opinions of the author and do not necessarily reflect those of Nasdaq, Inc.
Other Topics
Stocks
YCharts
YCharts
YCharts combines comprehensive data with powerful tools and outstanding customer support to enable clients to develop and visually communicate unique insights, make smarter investment decisions, and save significant time. YCharts is the one-stop shop for equities, mutual funds, ETFs, economic indicators, and market data.
Read YCharts' Bio