
 Credit: Shutterstock photo
Hickey and Walters ( Bespoke ) submit:
One of the problems with diversification is that during times of turmoil, asset classes tend to become highly correlated, defeating the purpose of the diversification in the first place. This was especially true during the financial crisis in late 2008 when hedge funds and other asset managers were hit with massive redemptions. This caused even a safe haven like gold to fall along with everything else.
As things have gotten dicey over the last month and a half, correlations between various asset classes within the equity markets have certainly spiked, but we've actually seen correlations decline significantly between equities and gold, the long bond, and dollar. This has at least softened the blow for investors that have exposure to these non-equity asset classes.
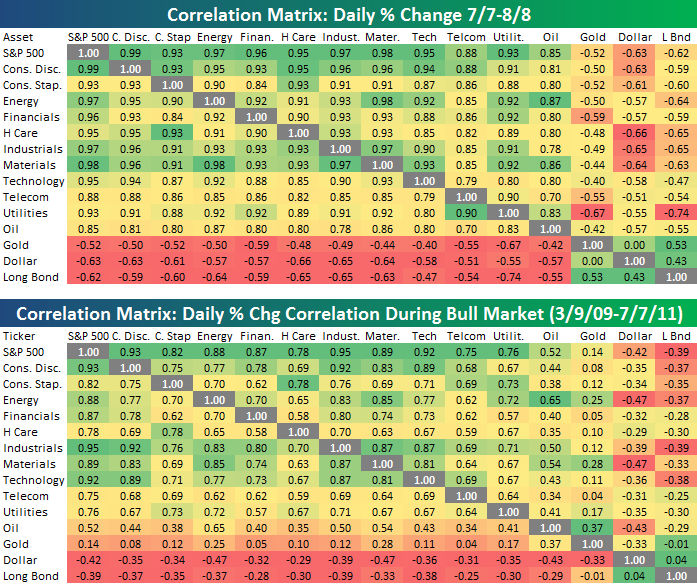
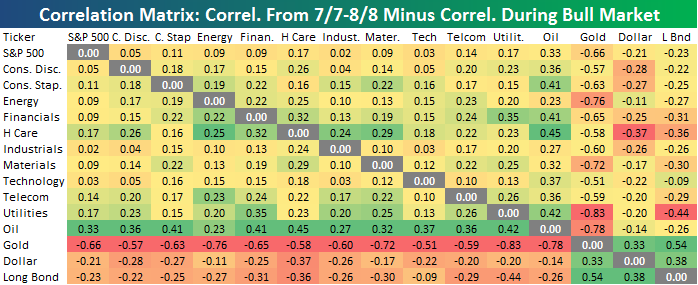
Below is a matrix that shows the correlations between the S&P 500, its ten sectors, oil, gold, the dollar, and the long bond from July 7th through August 8th, in which the S&P 500 declined 17.27%. (The correlation is based on the daily percentage changes for the various asset classes.) We also provide a matrix that shows the correlations from the March 9th, 2009 stock market low through July 7th. Finally, we provide a matrix that subtracts the correlations seen from 3/9/09 through 7/7/11 from the correlations seen from 7/7 through 8/8. This highlights the difference between correlations during the recent downturn and the prior bull market.
As you'll see in the last matrix, correlations spiked significantly between the S&P 500, its ten sectors and oil. Utilities and Health Care are two of the most defensive sectors in the market, and during the rally from 3/9/09 through 7/7, their correlation with the S&P 500 was just over 0.75. From 7/7 through 8/8, their correlations with the S&P 500 spiked to 0.93 and 0.95, respectively, which is an increase of 0.17. This was the biggest spike in correlation between any sectors and the S&P 500, and it means that investors who were hoping that defensives would offer a place to hide during the carnage were left pretty much just as exposed as anyone else.
As mentioned earlier, while correlations between various parts of the equity market spiked, they dropped significantly between equities and gold, the dollar and the long bond. The biggest drop was seen in the correlation between equities and gold, as stocks dropped and gold surged. In fact, the correlation between gold and all ten S&P 500 sectors from 7/7 through 8/8 fell by more than 0.50 versus their correlations during the bull market.
While sector diversification has proven to be worthless as markets have tanked over the past month and a half, exposure to gold and fixed income has been extremely beneficial. It also shows the difference between now and late 2008 when "the baby was getting thrown out with the bathwater" nearly across the board. Market bulls can take comfort in this because we certainly want to see as few comparisons to the financial crisis as possible. But bears are probably thinking that we just haven't gotten there yet.
click to enlarge
See also The Largest Bubble Out There Continues To Expand on seekingalpha.com
The views and opinions expressed herein are the views and opinions of the author and do not necessarily reflect those of Nasdaq, Inc.
The views and opinions expressed herein are the views and opinions of the author and do not necessarily reflect those of Nasdaq, Inc.

