
 Credit: Shutterstock photo
By Kippington Capital Management :
Business Summary
First National of Nebraska ($FINN) is a bank holding company that owns First National Bank of Omaha, the largest "privately-owned" bank in the country. I put privately-owned in quotes since the bank is only majority-privately-owned. Upon reviewing the bank's website (where the company cites their private family ownership) you wouldn't guess that the holding company is in fact publicly (albeit thinly) traded. The bank was founded in 1857 by the Kountze brothers and has been run primarily by members of the Creighton, Davis, and Lauritzen families since then.
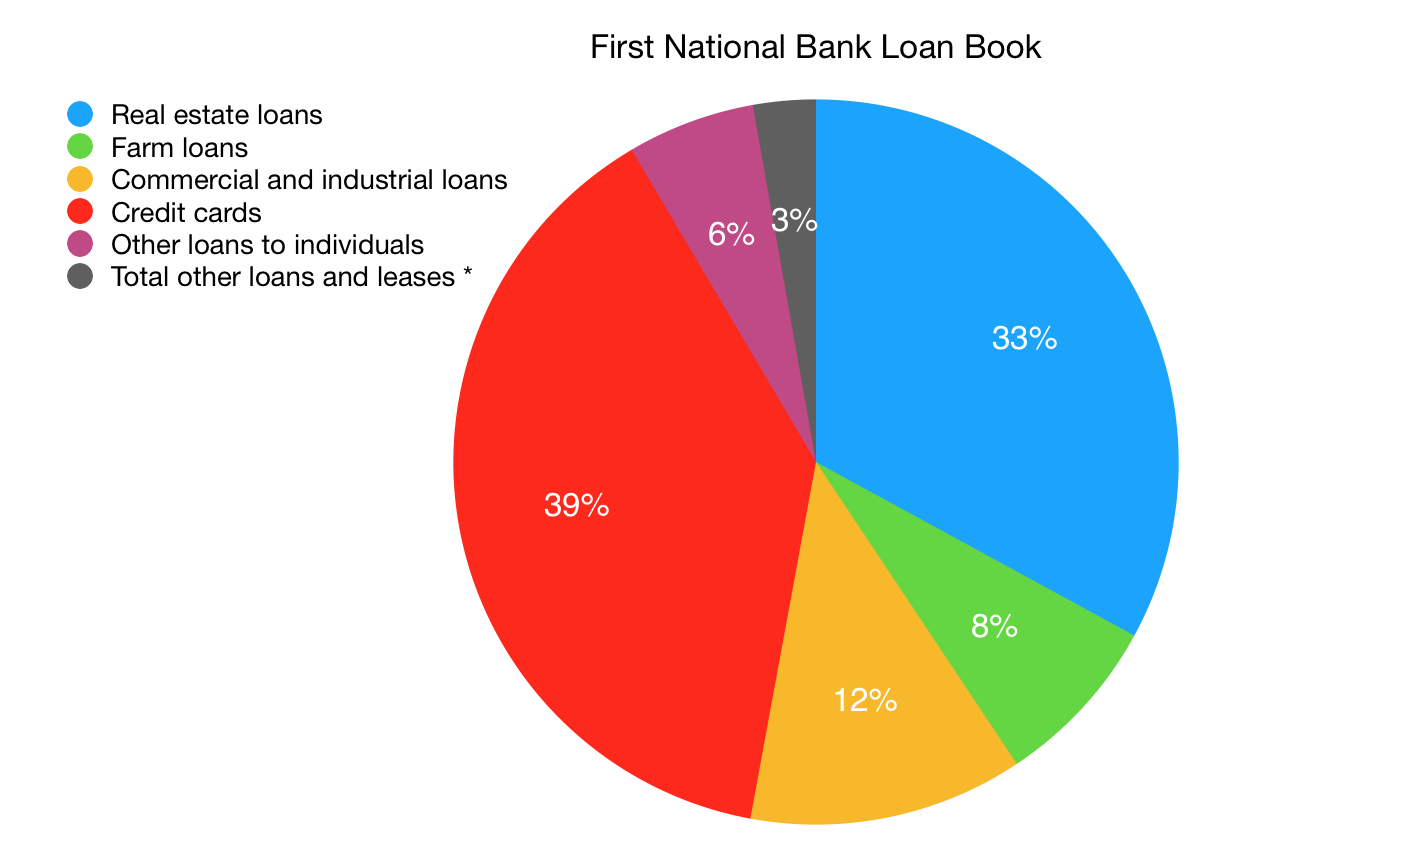
First National Bank, commonly associated with helping build Omaha into what it is today, has expanded from Nebraska into Colorado, Texas, Kansas, South Dakota, Iowa, and Illinois. The company also branched out from simple banking in 1953 becoming the fifth bank in the nation to issue its own credit card. Today, First National Bank services a book of loans and other assets of $19.3B as of September 30, 2017 (see below breakdown of loan book) and issues credit cards to other banks and third parties. Despite the holding company's shares trading over the counter, First National is the 51st largest bank in the US as of the beginning of 2017 according to Forbes.
Source: FDIC Call Reports
The holding company does hold other assets, but, as of the end of 2016, First National Bank accounted for 95% of the holding company equity and 98% of the year's net income ( FDIC Call Reports ). Given that there is very little long-term data on the holding company, this article will focus on the operations of the bank. Other assets are minute in comparison and can be considered "kickers" that aren't factored into the valuation.
As of September 30, 2017, FINN has 278,418 common shares outstanding and no preferreds in its capital structure.
Four-Point Analysis
Competitive Moat
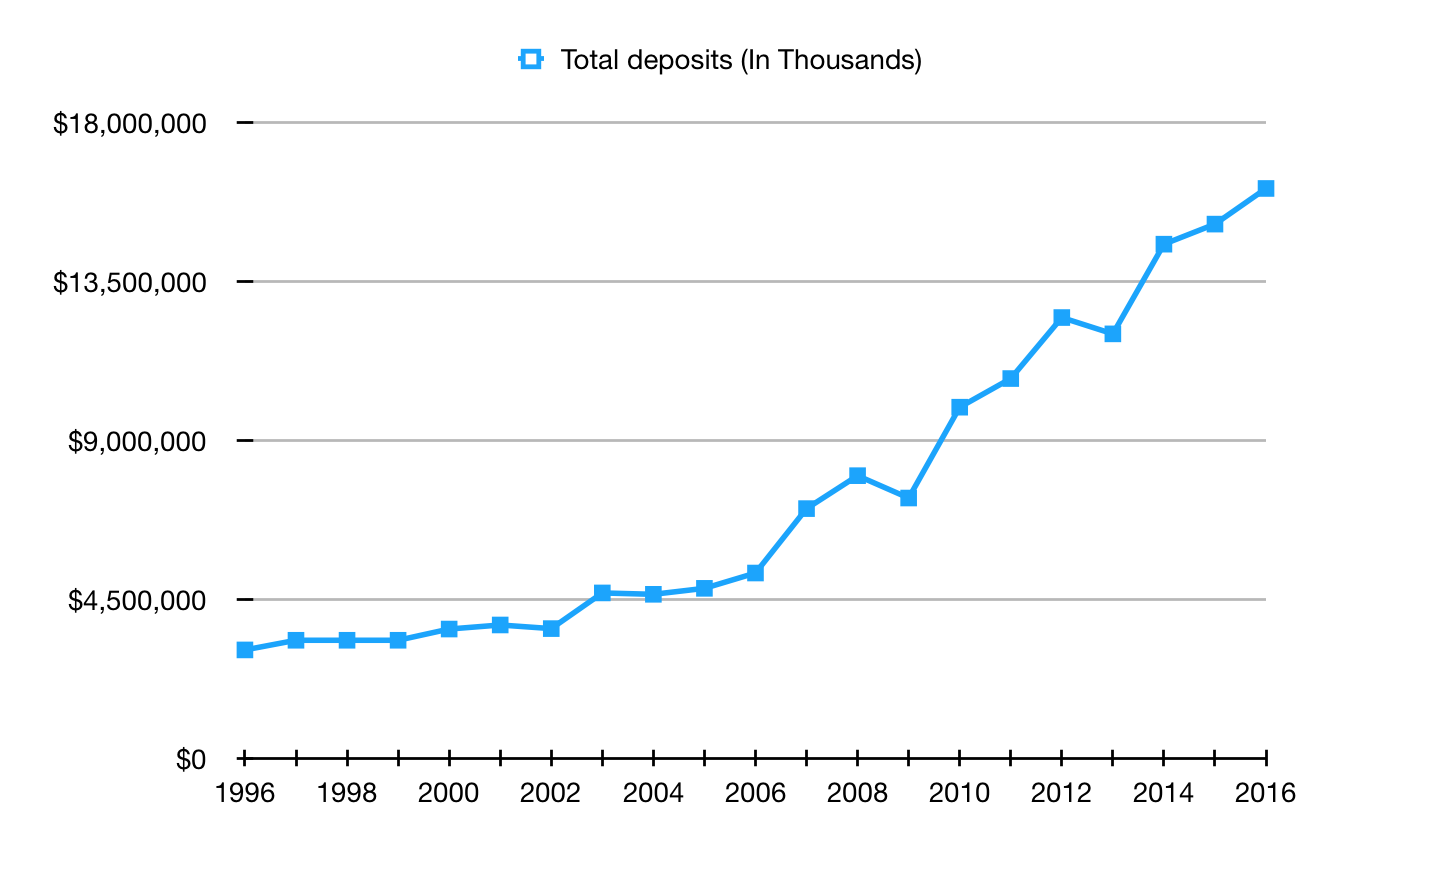
One of the first items we look for to determine a bank's competitive advantage is its deposit growth. To put it simply, deposit growth at First National Bank has been absolutely excellent. The company has compounded deposits at an average 11.9% over the past 10 years, and a slower 8.7% over the past 20 years (as measured against the end of 2016). Loans have seen similarly impressive growth of compounded 12.3% over the past 10 years and 9% over the past 20 years.
These numbers persisted through the rising rates of 2003 - 2007 and the falling and flat interest rates of 2009 to 2016 showing that First National has built a strong brand that both attracts and retains customers in varied rate environments.
Source: FDIC Call Reports
The capital allocation of First National is a strong advantage that, similar to Bank of Utica ($BKUTK) which we recently reviewed, no doubt stems from significant management ownership and lack of Wall Street influence. The bank has operated with great ROEs and ROAs (discussed in financials section) post-financial-crisis with an average tier 1 capital ratio of roughly 11% and an average during-financial-crisis ratio of about 8%, both well above the Fed's highest definition of "well-capitalized" at 6%. The bank has consistently bought back shares, and pays a regular dividend of currently $100 per share per year as well as frequent special dividends. This shows that their use of capital is both reasonably conservative while also prudent and rewarding for shareholders.
The bank's cost structure should not be ignored. First National's efficiency ratio has steadily declined since the financial crisis and now sits at roughly 58%, a strong showing for any bank.
Their last competitive edge (we wouldn't stretch to call it an advantage or moat) may lie in their position within the credit card issuance market. First National runs a partner program for issuance of credit cards to third parties and other banks with roughly 600 partners involved. With that said, they are only the 15th largest institution in credit card issuance in the US based on outstanding balances as of December 31, 2016 ( wallethub ), and the financial results from the business have been very volatile. The company's scale in this area gives an edge, but a larger institutional competitor could make inroads against them.
Management
FINN (the holding company) is chaired by Bruce Lauritzen with his son, Clark, serving as President. Board members include other family stockholders and members of management of the bank. Clark also serves as Chairman and President of First National Bank, and has been with the bank since 2003. The Lauritzen family via a privately-owned entity, Lauritzen Corporation, own at least 28% of First National (most likely much more), as that amount was a reported transaction in 2003 ( Government Publishing Office ).
The Lauritzens have a long history of operating banks. Bruce's father John was an ambitious banker, starting at First National in 1943 ( Omaha World Herald ), and, in 1947, becoming the youngest bank executive at the time at 29 years old. Bruce also had an ambitious career in banking, working with First National for several decades while also taking up ownership and executive positions in other banks.
Mike Summers has been the CFO of FINN since 2006, and also holds the position of CFO at First National Bank. He has seen the company through the financial crisis where it performed quite well given the environment. He has a background in auditing and finance, and is also an inactive CPA ( FINN website ).
Overall, management has acted conservatively, yet prudently with capital allocation and has shown a willingness to be consistently shareholder friendly with ongoing share repurchases. Given the Lauritzen family's history of being involved with or directly operating First National through significant growth as well as periods of turmoil, and their significant ownership of the business, management seems geared to deliver strong long-term results to shareholders.
Financial
The bank has a strong operating history with an average 11% ROE over the past 5 years and 12.6% to 15% throughout 2008 - 2010.The company has achieved an average ROA over the past 5 years of 1.11%, and an average of roughly 1% through the financial crisis. Since First National Bank operates both banking as well as credit card issuance services, it is important to understand which is driving these great results.
Net interest income (purely interest income net of interest expense) has been growing at a whopping 16.7% CAGR over the past 10 years and a still-impressive 7.8% for the past 5 years. Net interest margins have been steady with a long-term average close to 5% and a post-financial-crisis of roughly 6%, pretty impressive results given most banks are currently in the 2-3% range.
Unfortunately, the same praise cannot be heaped on their credit card issuance business. First National books revenue from interchange fees. These fees are assessed to another bank or merchant in a credit card transaction; call it First National's fee for issuing the credit card for the third party.
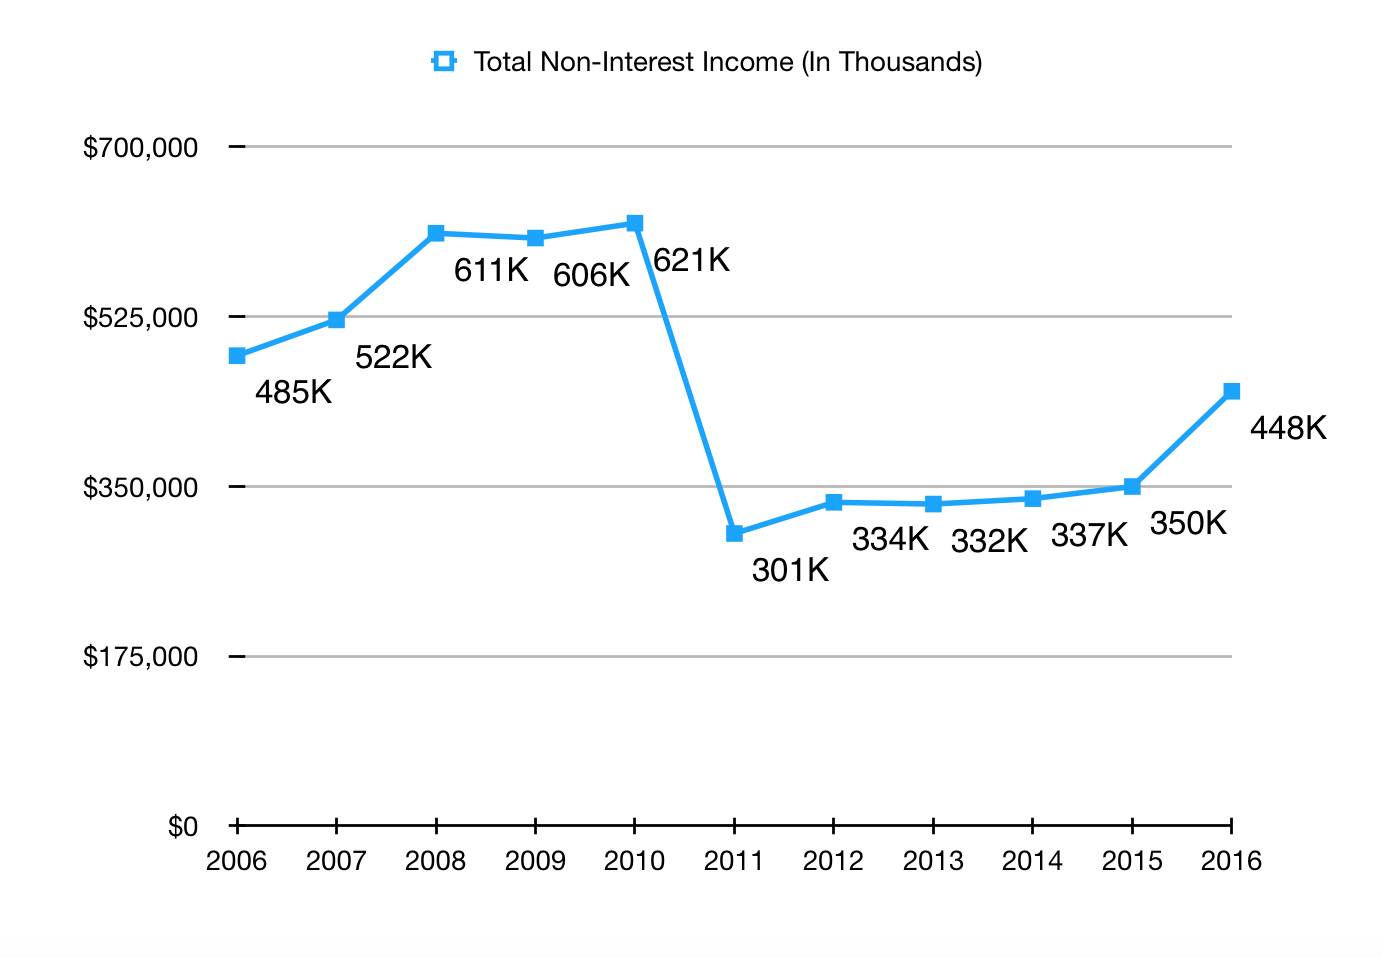
These fees were seen as arbitrary gouging, and in some cases, considered price fixing among competitors. At the end of 2010, as a bolt-on part of Dodd Frank, the Durbin Amendment (named for the IL senator), put a cap on interchange fees that issuers were able to charge. The amendment dramatically lowered this portion of First National's revenue as seen on the chart of non-interest income below. The company's sale of the credit card processing business (providing the machines and infrastructure to process card transactions) in early 2010 likely also contributed to the significant downturn in 2011.
Non-interest income should be evaluated from 2011 onwards to find a normalized value as it is unlikely the bank will reach pre-Dodd Frank levels of fees any time soon - see the below chart.
Source: FDIC Call Reports
With that said, that part of the bank has still been growing. The year 2016 was a record year in recent times, but it seems to be a one-off situation as non-interest income has dropped back to prior-year levels in YTD 2017. Looking at the four years from 2011 to 2015, the company achieved a 3.8% CAGR. This seems to be a more normalized value to expect in the future.
Using that growth rate from calendar year 2015 to 2016 (effectively removing the large increase), we have 2016 normalized non-interest income of $363.06MM. At the bank's effective tax rate of 36.66%, to bring non-interest income down to this level would have reduced 2016 net income to $159.27MM, significantly lower than the prior two years. The drop in non-interest income from 2011 onwards puts an asterisk by their previous great results and does create some difficulty in interpreting whether their performance will be as strong in the future.
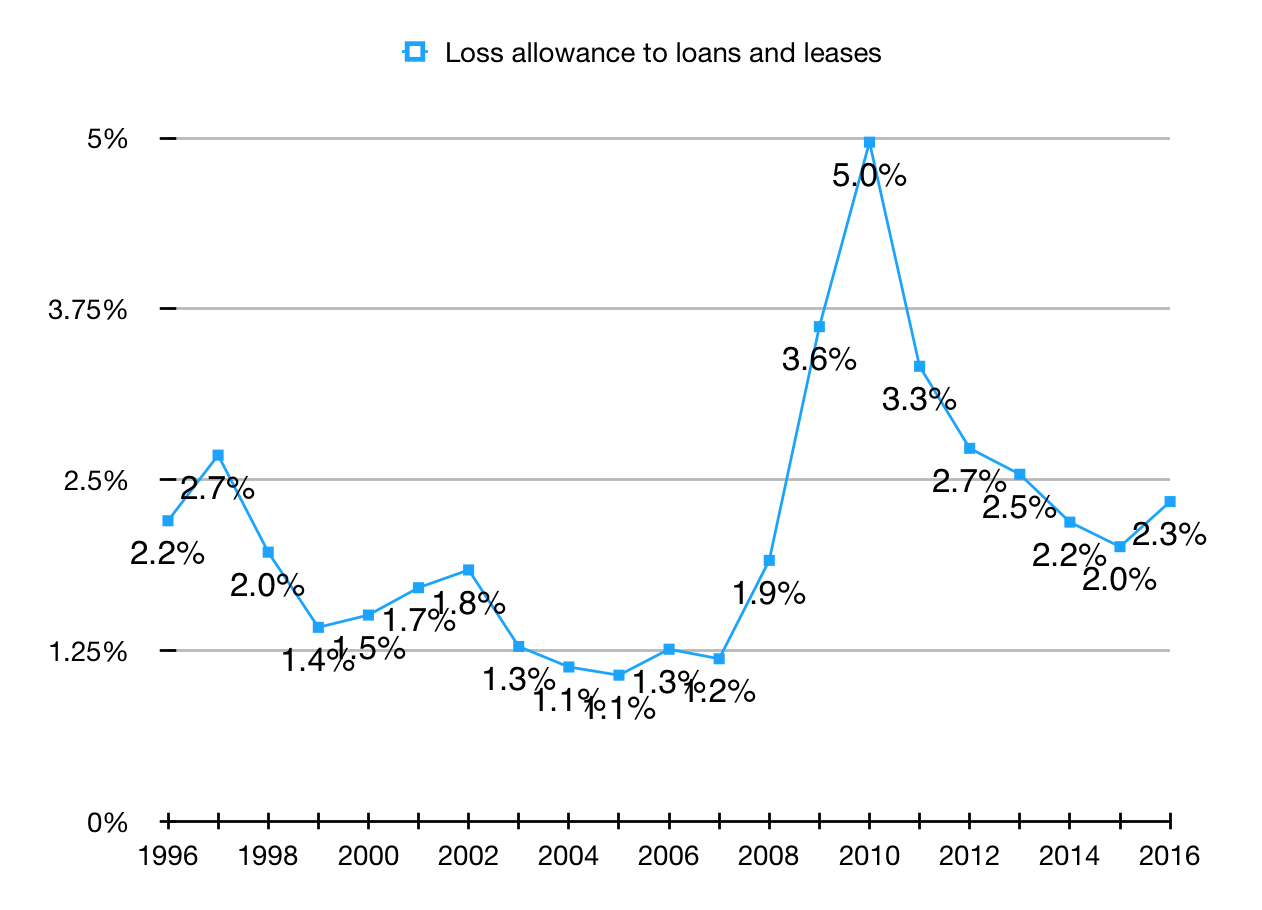
Another important note to make is the rising delinquencies in credit card debt given First National's substantial credit card loan book. The entire industry has noted an uptick in the past couple years, and First National is no different. They provisioned 50% more in 2016 than 2015. At the end of 2016, loss allowance as a portion of total loans was 2.3%, and as of September 30, 2017, it's even higher at 2.64%, almost the same level as 2012 (see below chart). It's entirely speculative to say whether there will be more delinquencies but it is important to note for establishing near-term expectations and a margin of safety.
Source: FDIC Call Reports
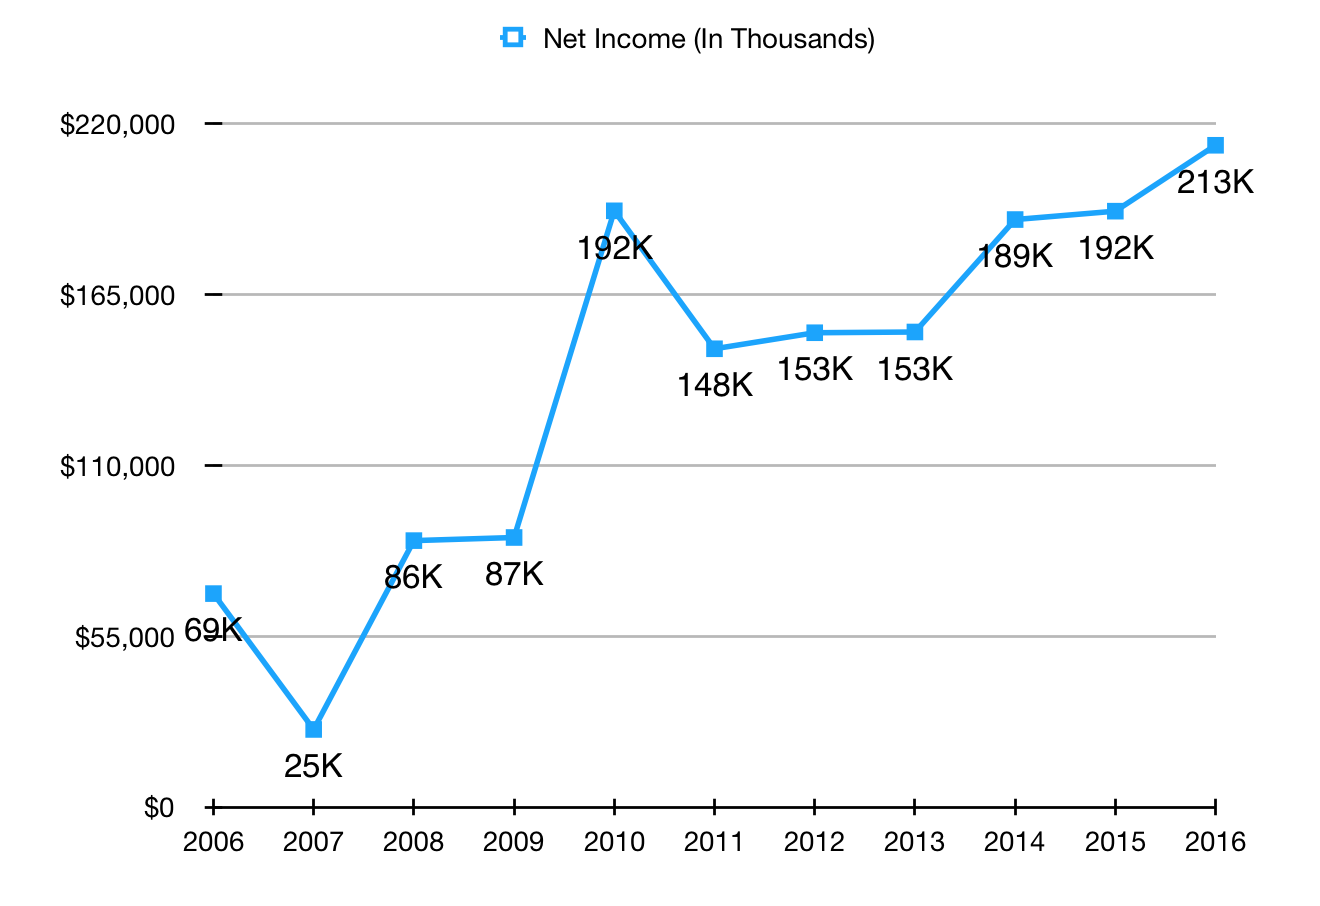
With 2016 normalized earnings of $159.27MM, earnings are fairly flat over the past 5 years, forsake a jump in 2014 and 2015. Given the rising loss provision and the the likelihood of having flat 2017 earnings, it would be most prudent to use an average of the past 5 years (ending December, 2016) including the normalized net income number from 2016 to generate normalized earnings for the bank. This calculation yields $169,174,600. See below for chart of net income (note the normalized amount for 2016 is $159.27MM).
Source: FDIC Call Reports
Valuation
In order to come to a relevant valuation for FINN, it would be most productive to look at the valuations of competitors. A simple Gordon Growth model may not accurately capture the possible returns to shareholders via repurchases, and a buy-out valuation wouldn't be appropriate as the bank will most likely never be sold.
When giving a company a valuation, we are looking for absolute value, not relative. This is crucial as many banks have been pushed to P/E and P/B ratios that can only be justified by the fulfillment of the most optimistic scenarios.
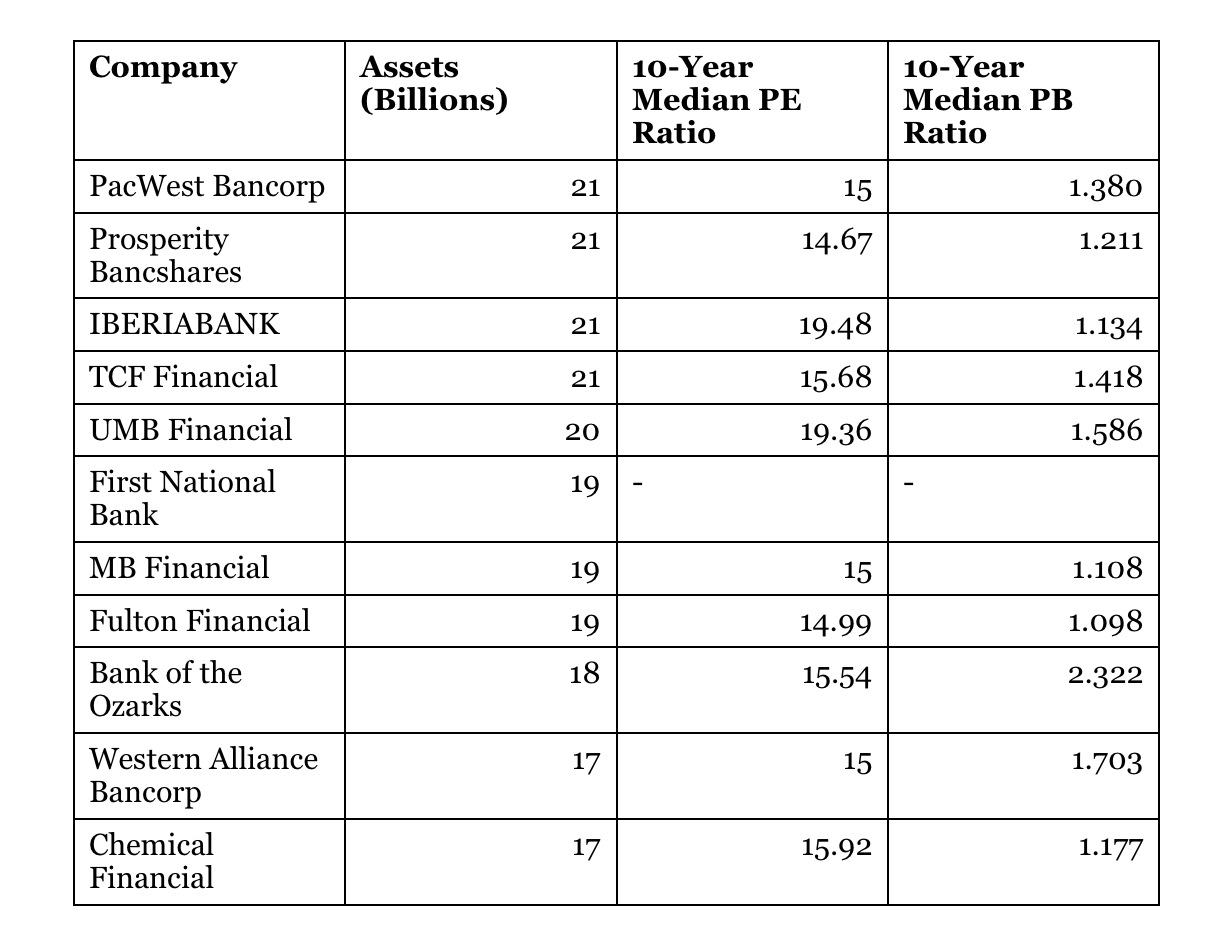
Below is a table of the 10 banks that surround First National (five bigger, five smaller) as of the beginning of 2017. The table includes the competitor's median valuations over the past 10 years so as to give a better comparison of absolute value.
**Three banks (PacWest, MB Financial, and Western Alliance did not have median PE ratios for the appropriate timeframe as they all had several loss years in the financial crisis. They were given an estimate of 15 as they would have all been very near to that level. PrivateBancorp was omitted as it has been acquired, and First Hawaiian was omitted as it is only recently publicly traded.
Source: Forbes
The average of the median PE and PB ratios (that's a mouthful) is 16.06 and 1.414, respectively. Applying a 16.06 PE to normalized earnings would yield a valuation of $2.557B or $9,187 per share. FINN has a book value as of September 30, 2017 of $2.002B. If instead we use the PB ratio, we have a valuation of $2.832B or $10,170 per share. An investor might observe that FINN's shares are more illiquid than most of the competitors mentioned and may ascribe some sort of discount based on that illiquidity. However, we consider all equity positions illiquid, and therefore, consider no discount justifiable simply because it takes longer to buy and sell the stock.
In fact, we find little reason in the business history of the company to justify any meaningful discount against its peers and consider the valuation a fair one. That being said, a margin of safety is important given the recent increase in credit card delinquencies as it may increase further resulting in additional write-offs. A 20% discount to the fair value would yield a share value of between $7,349 and $8,136. The shares have recently traded in this range.
Conclusion
FINN is a regional bank with almost $20B in assets and a strong brand that maintains deposits through varied rate environments. The bank is family-owned and operated by reasonably conservative and intelligent capital allocators. Management has shareholder interests at heart, working to keep expenses low, bolster the balance sheet, and repurchase shares.
The bank operates a loan book that is primarily credit card loans (39%) as well as a credit card issuance business. Despite the downturn of the credit card issuing business in 2011, it has seen decent growth since and continues to be a cushion in the event of future stressed years. On the other side, the banking business has performed very well and continues to offer net interest margins around 6%.
There is no knowing whether the recent increase in credit card loan delinquencies will snowball into a significant event, but it is worth keeping an eye on and requiring a margin of safety from a fair valuation of the company. If the 20% discount to fair value can be achieved and paired with a roughly 1.23% to 1.36% dividend yield (excluding special dividends) investors will most likely find themselves quite content with holding the common shares of First National of Nebraska over a long period.
See also Risky Reefer REIT: Innovative Industrial Properties Is A Bet On Management on seekingalpha.com
The views and opinions expressed herein are the views and opinions of the author and do not necessarily reflect those of Nasdaq, Inc.
The views and opinions expressed herein are the views and opinions of the author and do not necessarily reflect those of Nasdaq, Inc.

