
Shares of companies that benefited from the pandemic have been crushed in the past few months. That's something shareholders of Fulgent Genetics (NASDAQ: FLGT) have gotten used to. The stock peaked early last year and has been yo-yoing ever since.
The ups and downs have depended on what's happening with COVID cases. With that in mind, Wall Street may be too bearish on the company right now. These three charts show why.

Image source: Getty Images.
A close relationship
It shouldn't shock anyone that the number of COVID cases in the U.S. is correlated to the number of tests Fulgent Genetics provides in a quarter. Just how tight that correlation is might be a surprise.
Both ramped up through 2020 and peaked in early 2021. Now, tests are once again setting records.
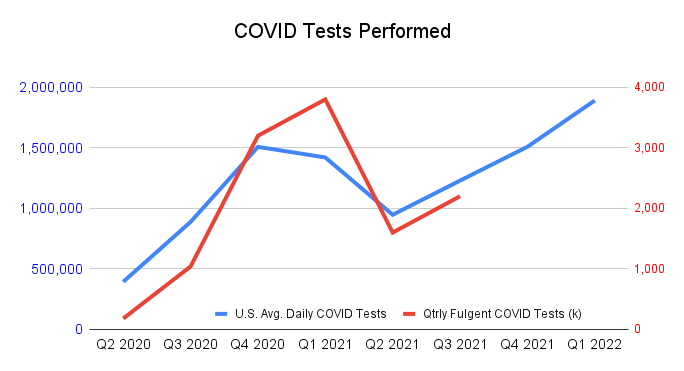
Data source: Fulgent Genetics; U.S. Centers for Disease Control. Chart by Author.
It's important to make the distinction that Fulgent benefits from elevated testing levels. While testing and cases have typically gone hand in hand, the mere existence of COVID will drive some testing, regardless of actual cases. For now, both numbers remain high.
Since we have more than a full quarter of U.S. testing data since Fulgent last reported earnings, it's a rare instance where investors have insight into a key operational metric ahead of time. And that metric ties directly to a financial one -- sales.
Pattern recognition
Perhaps not surprisingly, a chart of revenue for Fulgent looks similar to the one for testing volume. That makes it very likely that fourth-quarter sales will come in much higher than the $189 million the company projected. The last time daily testing was this high for a quarter, it produced $360 million in the quarter.
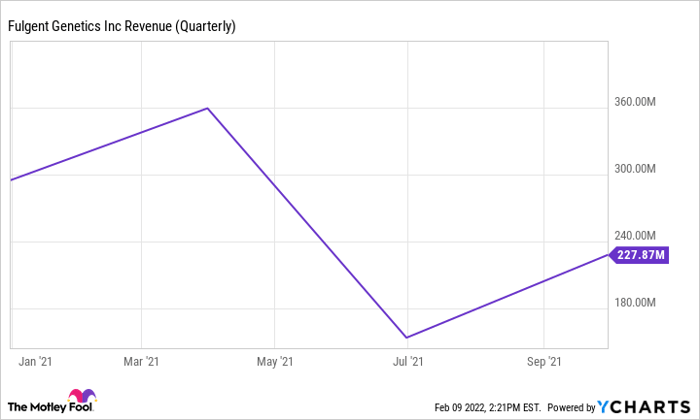
FLGT Revenue (Quarterly) data by YCharts.
Management was already calling for $930 million in full-year 2021 sales. Analysts are expecting the same. Based on the charts, that target should get obliterated when the company reports.
How long can it last
Fulgent stock traded as high as $190 per share in the mania of early 2021. Shares now change hands at roughly $70 per share. It may seem odd when U.S. daily testing volume is near a record, but the stock is off 60% from the high. However, it is up 30% from the recent low.
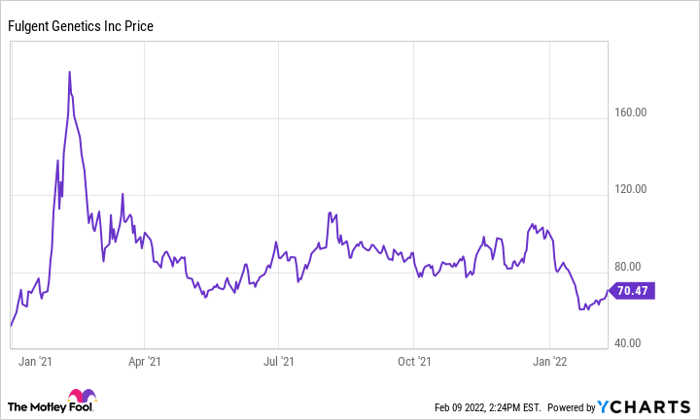
That overall drop is primarily due to the expected end of the pandemic. At some point, the need for constant testing will subside -- through either the absence of the virus or fear of it.
That said, the numbers speak for themselves. Even an eventual decrease in testing won't prevent blowout numbers in the upcoming report. Looking closely at 2022, that elevated volume will likely persist, at least for another quarter.
Fulgent has a robust genetic-testing business outside of COVID that's slated to more than triple in 2021 to $115 million. That core business could provide a floor to the stock price even if -- and hopefully when -- COVID wanes.
In the meantime, anyone betting against the stock should be prepared for some of the best numbers out of Fulgent Genetics since SARS-CoV-2 started spreading.
10 stocks we like better than Fulgent Genetics, Inc.
When our award-winning analyst team has a stock tip, it can pay to listen. After all, the newsletter they have run for over a decade, Motley Fool Stock Advisor, has tripled the market.*
They just revealed what they believe are the ten best stocks for investors to buy right now... and Fulgent Genetics, Inc. wasn't one of them! That's right -- they think these 10 stocks are even better buys.
*Stock Advisor returns as of January 20, 2022
Jason Hawthorne has no position in any of the stocks mentioned. The Motley Fool owns and recommends Fulgent Genetics, Inc. The Motley Fool has a disclosure policy.
The views and opinions expressed herein are the views and opinions of the author and do not necessarily reflect those of Nasdaq, Inc.

