Many of us first encountered fixed income not through bond ETFs, but through the physical savings bonds that were gifted to us as kids (thank you, Aunt Judy).
Although bond ETFs and savings bonds are a bit different, advisors know fixed income’s consistent payments and low correlation to stocks are vital to a well-balanced investment portfolio. So, what’s the best way to invest in bonds on behalf of your clients? By investing in bond ETFs, your clients gain exposure to fixed income, and the benefits it provides, with the least amount of hassle. Investors have taken notice, as they’ve poured cash into Bond ETFs over the past few years. The chart below shows the significant assets under management (AUM) growth in three popular Vanguard Bond ETFs since 2015.

Table of Contents
Best Performing Bond ETFs by Category
Investing in Bonds, Bond ETFs & Bond Mutual Funds
Important Metrics for Evaluating Bond Funds
Using YCharts to Find the Best Bond ETFs
Best Performing Bond ETFs by Category
These lists of the best-performing bond ETFs in key categories were identified using the YCharts Fund Screener.
Intermediate Core & Intermediate Core-Plus Bonds
See and Modify This Table in YCharts
The Screener identified Intermediate Core & Intermediate Core-Plus bond ETFs that rank in the top 75% among their category peers for 30-Day SEC Yield, Yield to Maturity, Distribution Yield, and Expense Ratio. Then, an objective Scoring Model was added to rank the screen results using an equal-weighted score that considers the above metrics.
These are the best performing Intermediate Core & Intermediate Core-Plus bond ETFs as of 12/16/2021.
• iShares Yield Optimized Bond ETF (BYLD)
• iShares Core 5-10 Year USD Bond ETF (IMTB)
• SPDR® Portfolio Aggregate Bond ETF (SPAB)
• Vanguard Interm-Term Bond ETF (BIV)
• Nuveen Enhanced Yield US Aggt Bd ETF (NUAG)
• VictoryShares USAA Cor Intmdt-Trm Bd ETF (UITB)
Short-Term Bonds
See and Modify This Table in YCharts
The Screener identified short-term bond ETFs that rank in the top 75% among their category peers for 30-Day SEC Yield, Yield to Maturity, Distribution Yield, and Expense Ratio. Then, an objective Scoring Model was added to rank the screen results using an equal-weighted score that considers the above metrics.
These are the best performing Short-Term bond ETFs as of 12/16/2021.
• Vanguard Short-Term Corporate Bond ETF (VCSH)
• iShares 1-5 Year invmt Grd Corp Bd ETF (IGSB)
• iShares Core 1-5 Year USD Bond ETF (ISTB)
• Western Asset Short Duration Inc ETF (WINC)
Corporate Bonds
See and Modify This Table in YCharts
The Screener identified Corporate bond ETFs that rank in the top 75% among their category peers for 30-Day SEC Yield, Yield to Maturity, Distribution Yield, and Expense Ratio. Then, an objective Scoring Model was added to rank the screen results using an equal-weighted score that considers the above metrics.
These are the best performing Corporate bond ETFs as of 12/16/2021.
• SPDR® Portfolio Corporate Bond ETF (SPBO)
• iShares Edge Investment Grade Enh Bd ETF (IGEB)
• iShares iBoxx $ Invmt Grade Corp Bd ETF (LQD)
• Goldman Sachs Acss Invmt Grd Corp Bd ETF (GIGB)
• iShares Inflation Hedged Corp Bd ETF (LQDI)
Ultrashort Bonds
See and Modify This Table in YCharts
The Screener identified ultrashort bond ETFs that rank in the top 75% among their category peers for 30-Day SEC Yield, Yield to Maturity, Distribution Yield, and Expense Ratio. Then, an objective Scoring Model was added to rank the screen results using an equal-weighted score that considers the above metrics.
These are the best performing Ultrashort bond ETFs as of 12/16/2021.
• iShares Interest Rate Hdg L/T Corp BdETF (IGBH)
• iShares Interest Rate Hedged Corp Bd ETF (LQDH)
• Goldman Sachs Access Ultra Short Bd ETF (GSST)
• Principal Ultra-Short Active Income ETF (USI)
• Janus Henderson Short Duration Inc ETF (VNLA)
Inflation-Protected Bonds
See and Modify This Table in YCharts
The Screener identified Inflation-Protected bond ETFs that rank in the top 90% among their category peers for 30-Day SEC Yield, Yield to Maturity, and Distribution Yield. Then, an objective Scoring Model was added to rank the screen results using an equal-weighted score that considers the above metrics.
These are the best performing Inflation-Protected bond ETFs as of 12/16/2021.
• SPDR® Portfolio TIPS ETF (SPIP)
• iShares TIPS Bond ETF (TIP)
Jump to ‘Using YCharts to Find the Best Bond ETFs’
Types of Bond ETFs
The spectrum of bond ETFs does not leave much to the imagination — there are innumerable ways to manage your fixed-income exposure through ETFs.
One route is to invest in the broad universe of bonds all at once by choosing products like the Vanguard Total Bond Market ETF (BND). This ETF largely consists of Treasuries but also includes investment-grade corporate debt, international bonds, and more. Below are a few different paths to fixed income exposure and bond ETFs that align with different fixed income types.
Government Bond ETFs
When you think of government bonds, U.S. Treasuries tend to come to mind. Treasuries are considered “risk-free” as investors prescribe no default risk to the U.S. government. For this reason, Treasury ETFs tend to have lower yields than other products — less risk, less reward, but hopefully more stability.
One option for exposure to relatively lower-interest rate risk Treasuries is the Vanguard Short-Term Bond ETF (BSV), which typically boasts an effective duration under 3, and allocates over 70% of its holdings into government bonds.

An integral word in any savvy advisor’s vocabulary is “munis.” Municipal bonds represent debt issued by a state, county, or municipality. Most importantly, munis are “tax-exempt” from federal and most state or local taxes. For tax-sensitive clients, the Vanguard Tax-Exempt Bond ETF (VTEB) may be worth a look.
Corporate Bond ETFs
Investment-grade bonds are the cream of the crop when it comes to corporate debt.
“Investment-grade” encapsulates all bonds with a credit rating of “BBB” or above, with “AAA” and “AA” signifying the highest credit qualities. A higher credit quality means a lower chance of default, but also a lower yield. An investment grade bond ETF like the Vanguard Long-Term Corporate Bond ETF (VCLT) pays out significantly more income than the 10 Year Treasury does while maintaining a relatively high credit quality.
When it comes to income, high yield bond ETFs offer the most. The appropriately tickered SPDR® Bloomberg Barclays High Yield Bond ETF (JNK) is quite attractive in this rate environment. But there’s no such thing as a free lunch; high yield (or “junk”) bonds are debt with a “below-investment grade” rating (anything BBB- or below), meaning the chance of the issuer defaulting is relatively high. Investing in junk bonds is high risk, but they can provide a valuable income stream for your clients in a well-balanced portfolio.
Jump to ‘Using YCharts to Find the Best Bond ETFs’
Investing in Bonds, Bond ETFs & Bond Mutual Funds
Investing in individual bonds within a client’s portfolio can be difficult — they’re typically sold over-the-counter (OTC), so they’re not as easy to trade. Bond ETFs, however, allow you to invest in hundreds or thousands of underlying bonds at once. Plus, casting a wide net in terms of bond exposure only aids in diversifying away from stocks. To top it off, bond ETF holders receive payments monthly (as opposed to semi-annual coupons) — and oftentimes can be automatically reinvested at no extra cost.
So that poses the question, why not invest in a bond mutual fund? Mutual funds typically report their holdings monthly, or semi-annually. To boot, they typically have a holding period of at least 90 days, and can only be traded once a day after the markets close.
While bond ETFs provide many advantages, they’re not perfect. Like all fixed income products, investing in bond ETFs exposes your or your client to interest rate risk, inflation risk, and credit risk.
However, bond funds are also subject to their lack of maturity — unlike Aunt Judy’s savings bond, there is no guarantee that the principal invested in a bond fund will be repaid in full. That being said, some firms have begun to offer ETFs with fixed maturity dates. Lastly, bond ETFs are passively managed; while actively managed funds are more expensive to own, hurting clients’ returns.
Jump to ‘Using YCharts to Find the Best Bond ETFs’
Important Metrics for Evaluating Bond Funds
Arguably the most important metric for any fixed-income product—yield—gets a bit tricky when evaluating bond funds. Three common yield figures you’ll see for every bond fund are the 30-Day SEC Yield, the Yield to Maturity (YTM), and the Distribution Yield.
30-Day SEC Yield: also referred to as “standardized yield”, it uses the fund’s last 30 days of interest to approximate the rate an investor may receive in the coming 12 months, after deducting expenses. Aptly named, it was developed by the SEC to allow for fairer comparisons of bond funds.
Yield to Maturity (YTM): the weighted average yield of all underlying bonds in the ETF, assuming they are held to maturity. However, YTM does not factor in the fund’s expenses, and ETFs do not typically hold bonds to maturity.
Distribution Yield: the ratio of all distributions paid by the fund in the past 12 months (i.e. income, capital gains, etc.) divided by the current value-per-share of the fund. The distribution yield can fluctuate wildly if the size of a bond ETF’s distributions spikes up or down between payments.
Below are some fundamental metrics for the Vanguard Total Bond Market ETF (BND). As you can see, the different yield metrics can vary significantly; you can use multiple yield metrics to evaluate bond funds, but it is important to understand their differences.

A couple more key metrics to keep in mind:
Average Credit Score: the weighted average credit rating of all underlying bonds in the fund. The closer to “AAA”, the better. Credit ratings below BBB- mean the average bond is below investment grade (also known as “junk” or “high yield”). With an average credit score of “A”, the Vanguard Total Bond Market ETF (BND) is considered high quality.
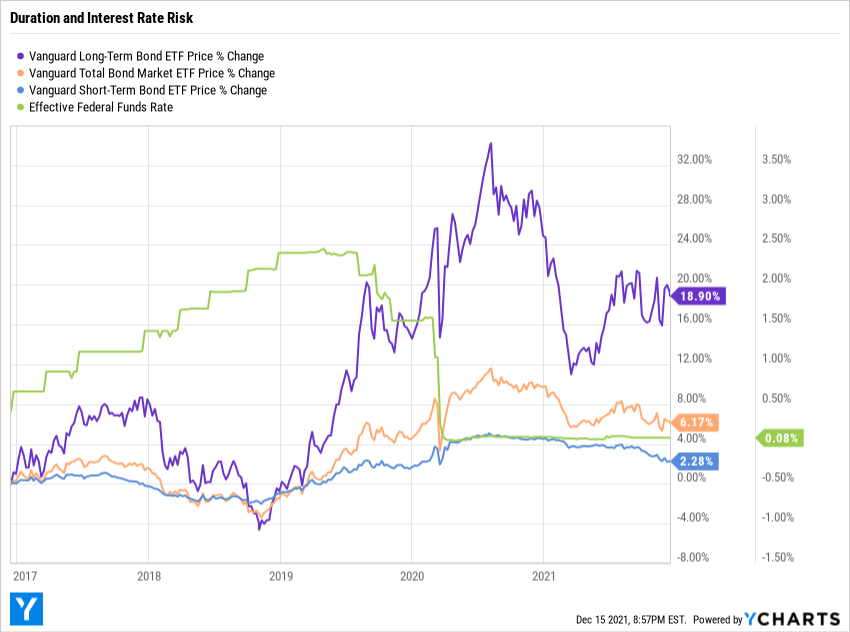
Effective Duration: represents the weighted average duration of the bond ETF. Duration is the expected change in a bond’s price in response to a change in its yield and is largely affected by the underlying bonds’ maturity lengths — the longer the maturity, the higher the duration. The chart below illustrates this interaction; as interest rates fall, bond ETF prices rise. The longer maturity (and therefore duration) ETFs like the Vanguard Long-Term Bond ETF (BLV) show a greater price increase, while the shorter maturity Vanguard Short-Term Bond ETF (BSV) only appreciated marginally.
__________________________________________________________________
Using YCharts to find the Best Bond ETFs
YCharts tools enhance your bond ETF research, allowing you to make the most informed decisions for your clients’ portfolios. Below are a few impactful ways that YCharts helps you find the best bond ETFs.
Screen for Bond ETFs
With hundreds of bond ETFs out there, the Fund Screener helps you apply custom criteria and find the needle in the haystack for your clients. As a starting point, spark your research with pre-built fixed income ETF screens, such as the Tax-Preferred Municipal Bond ETFs, ESG-Friendly Bond ETFs, or Fixed Income ETFs with the Most Inflows templates.
The custom-built Top Performing Bond ETFs screen below finds bond ETFs with above-average 30-Day SEC Yields, high returns over the past few years, and relatively low expense ratios.
Bond ETF Comparison Reports
YCharts Comparison PDF Reports help you compare ETFs, portfolios, and other securities clearly and concisely. Most importantly, you can tailor the data and visuals included in your report to guide your clients and prospects towards their investment goals. For that extra touch, customize PDF reports with your firm’s logo and colors. (YCharts Professional clients, customize your PDF Reports here.)
The YCharts Side-by-Side Comprehensive Report evaluates the performance, key metrics, and holdings of two bond ETFs, such as the aforementioned Vanguard Short-Term Bond ETF (BSV) and Vanguard Tax-Exempt Bond ETF (VTEB). See an example below.

Analyze Yield Using Scatter Plot
YCharts’ Scatter Plot enables you to plot any of YCharts’ 4,000+ calculated metrics for any combination of securities and allows you to visually analyze them head-to-head.
An important dynamic for any fixed-income fund is the relationship between its yield and duration. Current or prospective fundholders will want to know the income a fund can provide, but also that fund’s sensitivity to rate changes, as given by effective duration. Plotting fixed-income funds to determine which offer higher yields and lower risk of a price drop is revealing. Below, the Scatter Plot shows several Municipal Bond ETFs with “Effective Duration” along the X-axis and “30-Day SEC Yield” along the Y-Axis. For investors, the most attractive ETFs of the group have a lower effective duration and higher 30-Day SEC yield.

Evaluate Bond ETFs On-the-Go with Quickflows
While due diligence is important, no one wants to spend all day researching, analyzing, and comparing bond ETFs. Making comprehensive research faster and easier, YCharts Quickflows enable in-depth analysis in just a few clicks and free up time to spend with your clients.
There’s a swath of bond ETFs that track the same bond index or have similar strategies. The Find Similar ETFQuickflow is perfect for comparing expense ratios and returns across fund families, so you can find the best bond ETFs for your clients. Click here to see the Quickflow in action, finding bond funds similar to the Vanguard Intermediate-Term Corporate Bond ETF (VCIT).
Use the Credit Quality Exposure Quickflow to break down the credit exposures of up to 12 bond ETFs at once. Click here to see how this Quickflow compares some of the previously mentioned bond ETFs, or take a quick glance below.
See and Modify This Table in YCharts
The views and opinions expressed herein are the views and opinions of the author and do not necessarily reflect those of Nasdaq, Inc.

YCharts
YCharts
YCharts combines comprehensive data with powerful tools and outstanding customer support to enable clients to develop and visually communicate unique insights, make smarter investment decisions, and save significant time. YCharts is the one-stop shop for equities, mutual funds, ETFs, economic indicators, and market data.
Read YCharts' Bio