

Machine-learning forecast
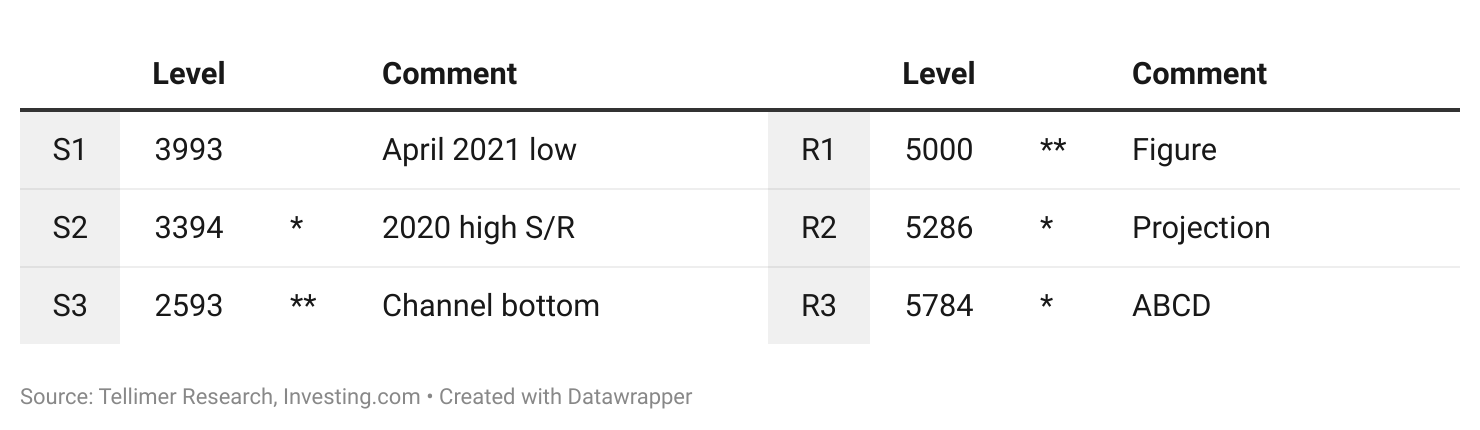
Our machine-learning model forecasts a predominantly sideways move for the S&P 500, accompanied by a moderate increase in volatility over the next 12 months. It forecasts a -8.5% drop to 4057 by January 2022, followed by a rally up to a new all-time high of 5081 by June 2022 – which is 14.6% above its current level.
Lastly, a sell-off down to 4304 by September 2022 leaves the S&P 500 down 2.9% from its current level.
Over-extension and capitulation
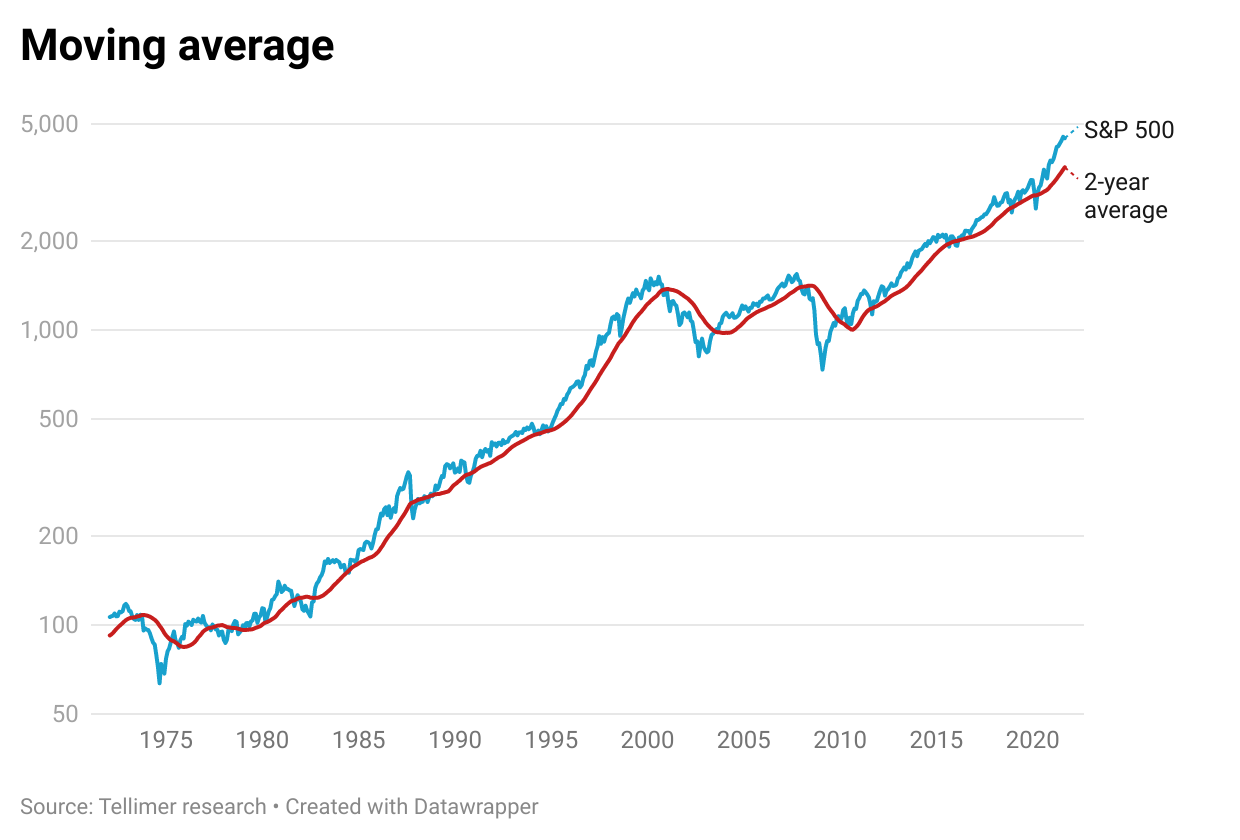
Analysing the historical divergence between the S&P 500 and its two-year moving average price gives one indication of how over-extended the market is and enables us to construct one-, three-, six- and nine-month expected returns.
Divergence
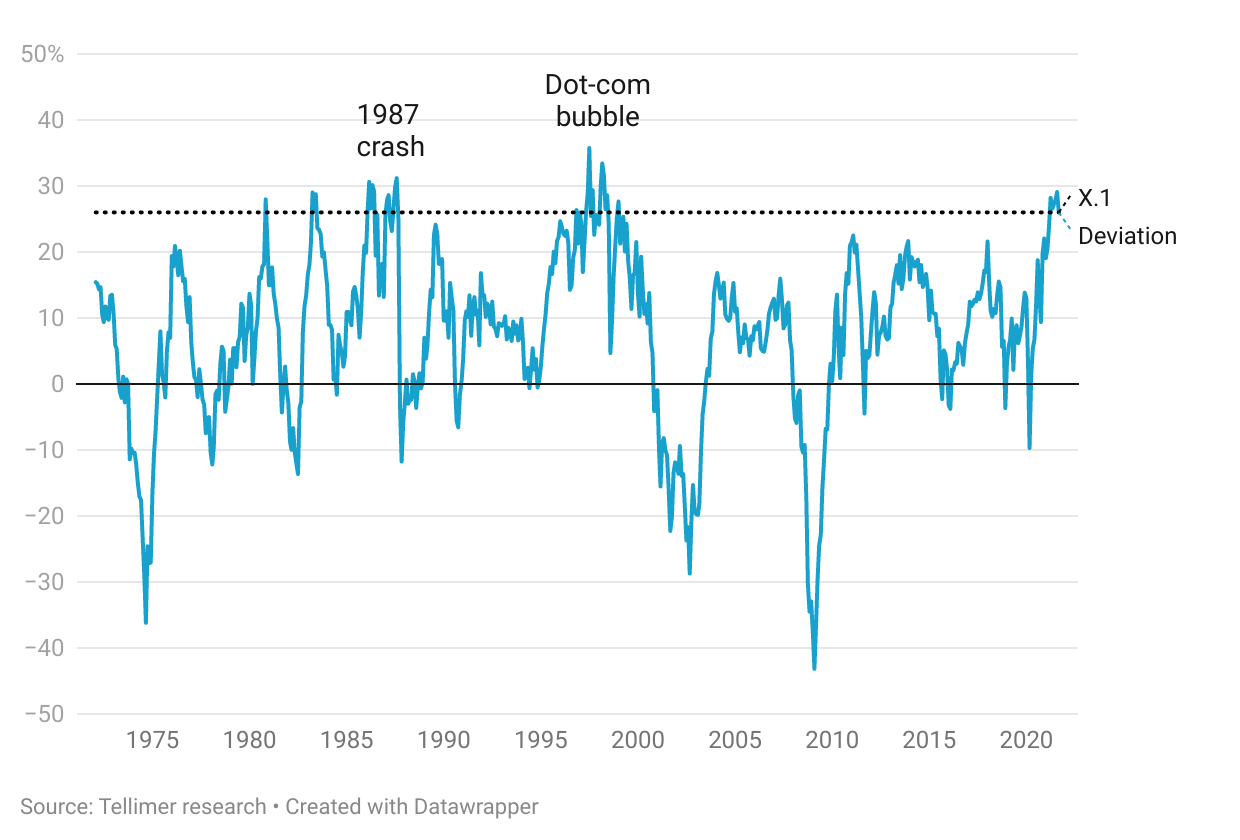
The S&P 500 is currently trading at a 26% premium to its trailing two-year historical average price. Fewer than 6% of all months historically have deviated this far from the two-year average since 1970, making it a reasonably extreme event.
Other notable periods that proceeded such an over-extension include the 1987 Black Monday crash and the 1999-2000 dot-com bubble.
Historical performance
Quantitatively, the times in which the S&P 500 has overextended by 26% or more in the past have led to a negative forward (projected) return over one- and three-month time horizons, and only a slightly positive return over six- and nine-month time horizons. All forward returns underperform the historical expected return of the S&P 500 over those time horizons.
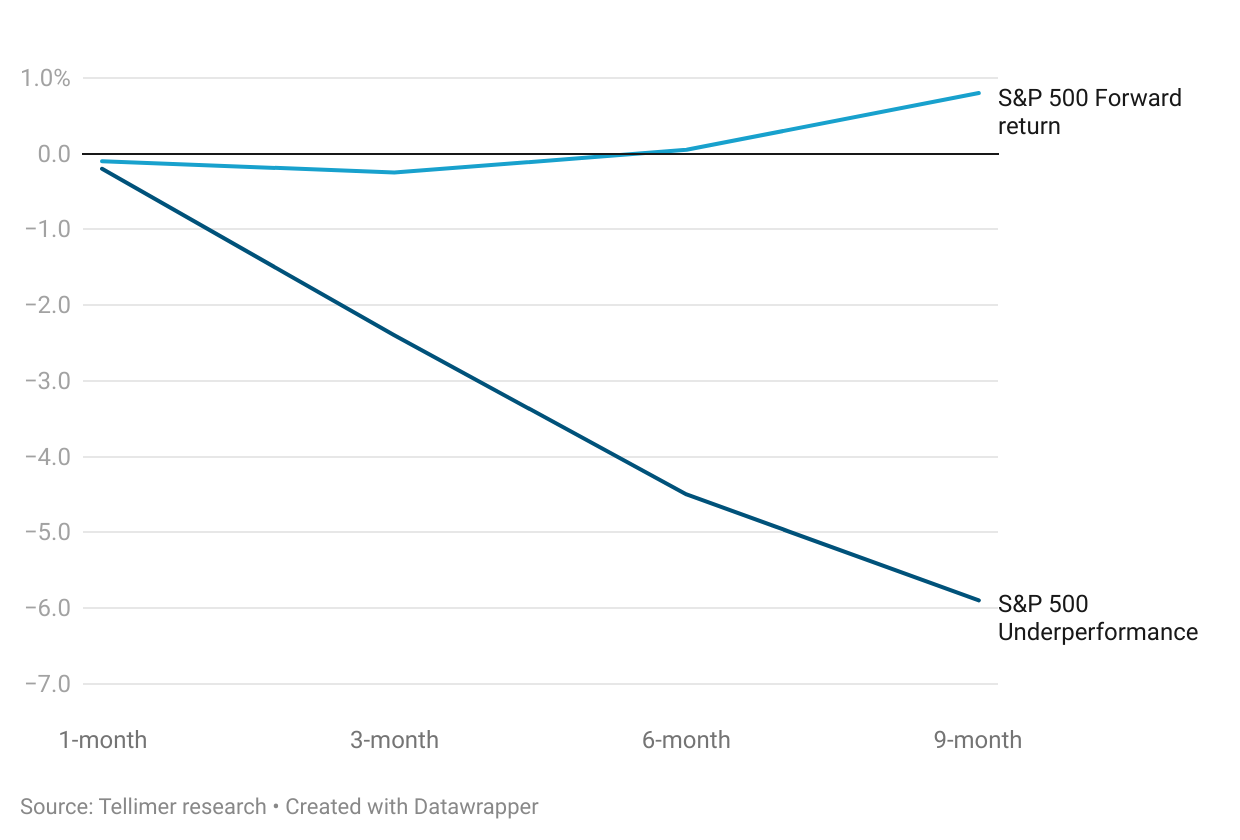
This highlights the expectation that the S&P 500 will trade predominantly sideways over the next nine months, leading to a period of relative underperformance – the magnitude of which will approach 6%.
The opposite end of the curve
For those who are curious, here is a graph of the forward returns for all historical periods that are over two standard deviations beyond the two-year moving average (both above and below).
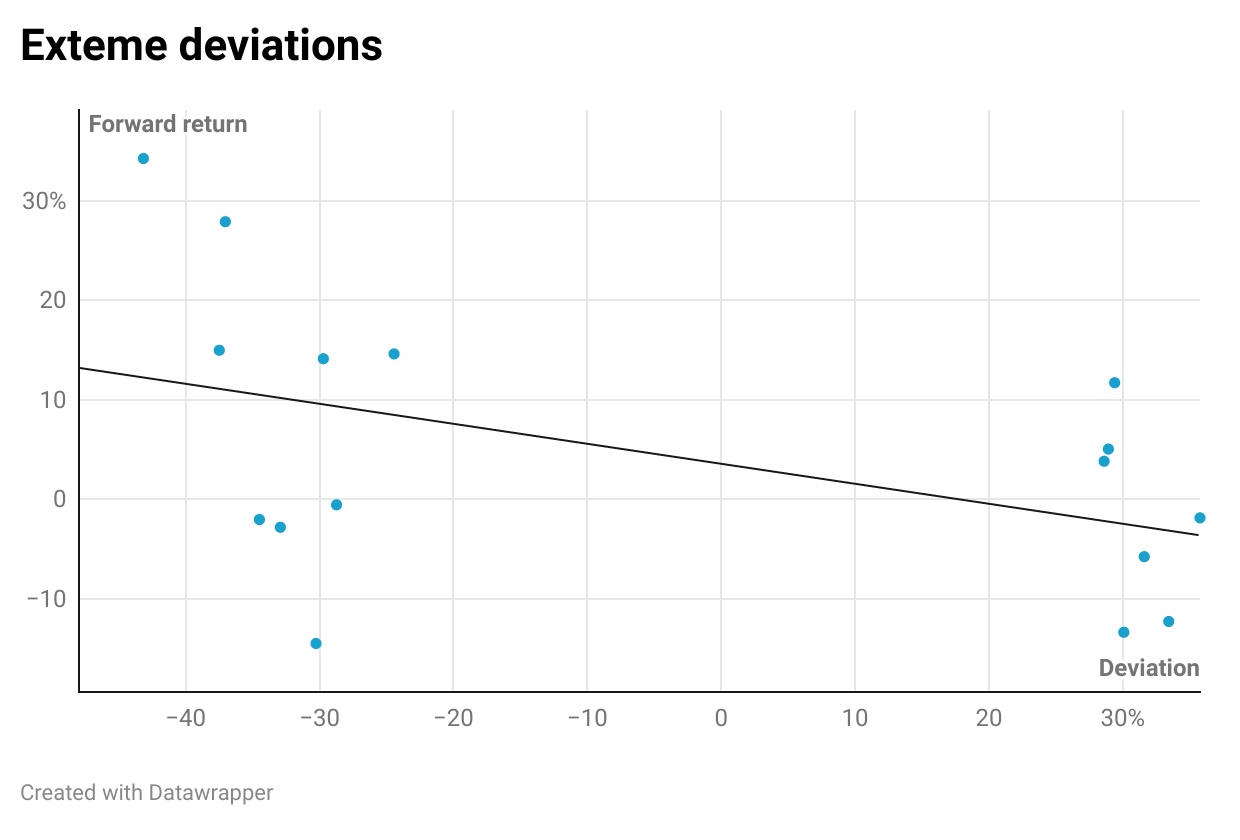
The linear regression line highlights a trend toward positive forward returns for large negative deviations (when the S&P 500 is a long way below its average) and negative forward returns for large positive deviations (when the S&P 500 is a long way above its average), such as where we are currently.
The views and opinions expressed herein are the views and opinions of the author and do not necessarily reflect those of Nasdaq, Inc.

