
Silver Traders Eye Inflation and Fed Moves
Silver bulls are witnessing a continued rally, with the metal notching its third straight day of gains on Friday. The driver: U.S. inflation data slowing, fueling bets on a Fed rate cut come June. While silver’s rally is underpinned by falling Treasury yields, gains are being checked by a slight uptick in the greenback.
At 12:42 GMT, XAG/USD is trading $22.73, up $0.06 or +0.28%.
Inflation Metrics and Fed’s Next Moves
Traders are dissecting the latest PCE index figures, the Fed’s go-to inflation barometer. January’s read shows a 0.3% month-on-month climb and a year-on-year uptick of 2.4%. Core PCE, less food and energy, also ticked up. Though these figures are a tad softer than December’s, they’re still north of the Fed’s 2% inflation comfort zone.
Rate Cut Speculation Heats Up
Market whispers around a summer rate cut got louder post comments from Atlanta Fed’s Bostic. The Fed crew, however, is playing it close to the chest, basing moves on solid data. The dollar index, after a nudge post-inflation news, is up 2.7% in the last couple of months.
Market Odds and ECB Watch
The trading floor is abuzz with a 67% probability of a June rate cut, per the CME’s FedWatch. Eyes are also on the ECB for any market-moving updates. The timing and extent of the Fed’s rate moves remain top of mind.
Short-Term Silver Outlook
January’s PCE, showing the lowest year-on-year rise since early 2021, signals easing inflationary headwinds. This opens a window for Fed rate cuts later this year, potentially pumping up silver’s allure as a non-yielding asset. A significant shift in investor preference from stocks, bonds and gold to silver hinges on the Fed’s rate reduction depth. Withsilver marketplayers awaiting further cues from today’s Fed speeches, the near-term outlook leans towards neutral, albeit with a sharp focus on Fed signals and broader economic data.
Technical Analysis
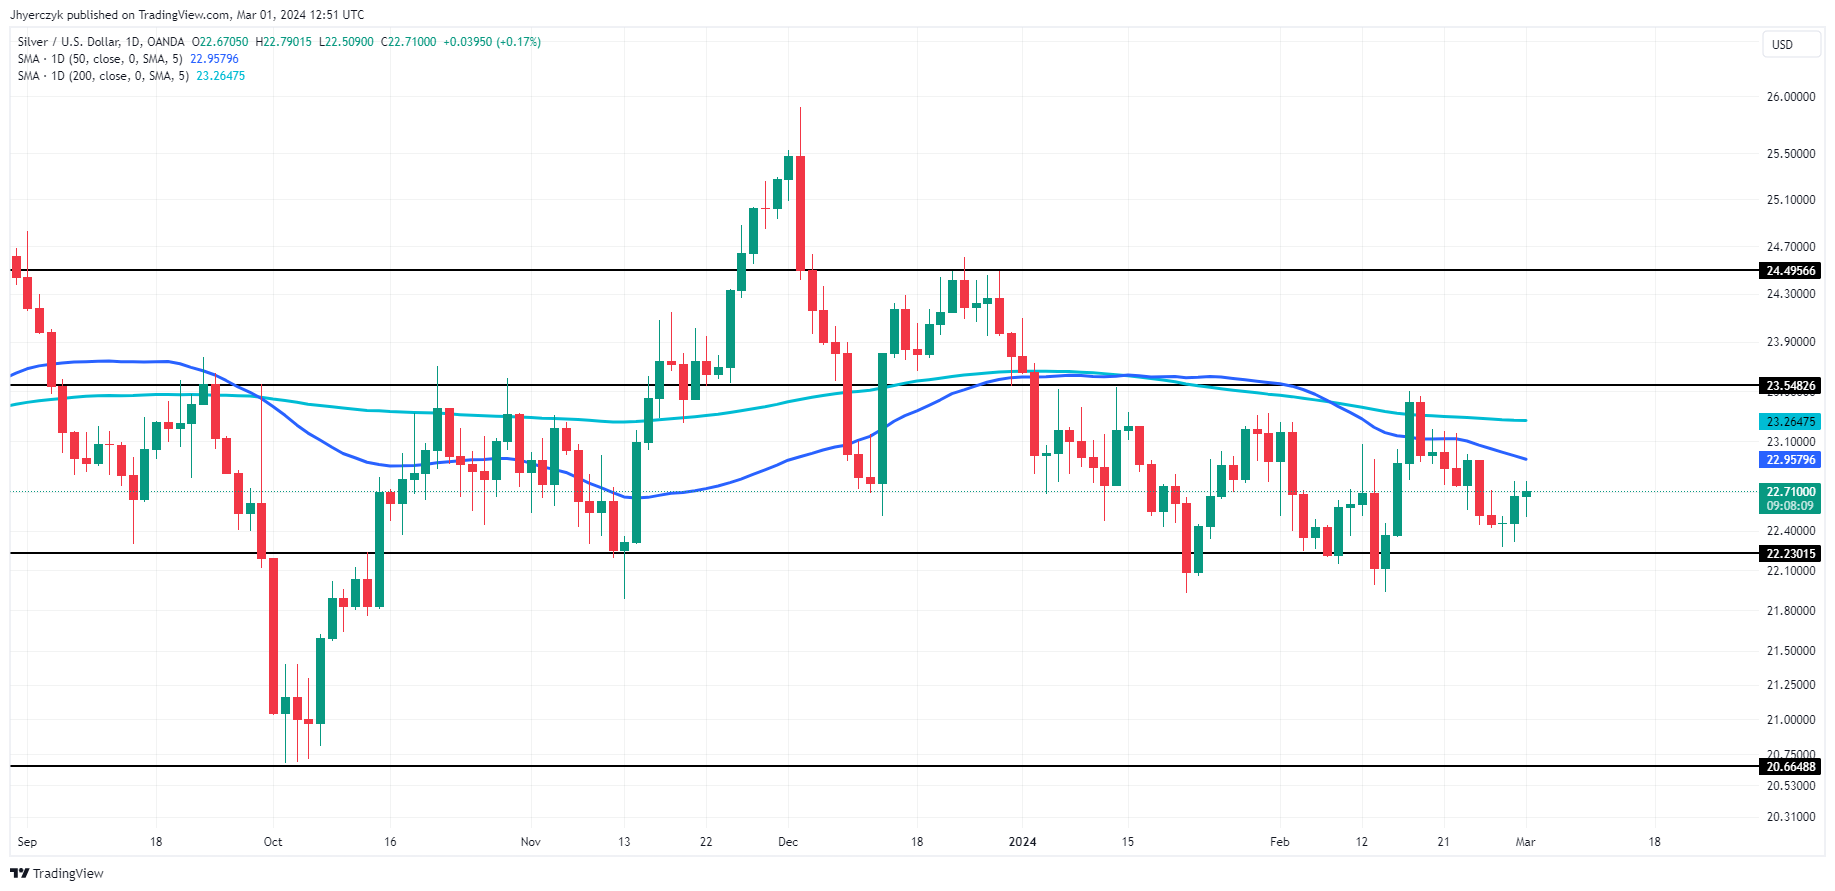 Daily Silver (XAG/USD)
Silver (XAG/USD) prices are edging higher on Friday after another sucessful test of the $22.23 to $21.88 support range.
The 50-day moving average at $22.96 and the 200-day moving average at $23.26 are the primary upside targets, having kept prices under pressure since the start of the new year.
Overcoming coming the 200-day MA could launch prices into $23.55 resistance, but we suspect this price to be the potential trigger point for an acceleration to the upside.
This article was originally posted on FX Empire
More From FXEMPIRE:
- Nasdaq 100, Dow Jones, S&P 500 News: Tech Rally, Energy Rise Push Markets Upward
- Crude Oil Price Forecast – Crude Oil Continues to Build Pressure For a Breakout
- Nvidia Weekly Price Forecast – Nvidia Continues to Find Buyers
The views and opinions expressed herein are the views and opinions of the author and do not necessarily reflect those of Nasdaq, Inc.

