

Take a minute and think about your baseline expectations. These are things that we subconsciously expect as we move through our days, weeks, and months. It’s wild how quickly exciting outliers become our expectation. A few examples should make this clear.
- Seatbelts in cars: New York became the first state to require mandatory use of seat belts…in 1984. New Hampshire still only requires passengers under the age of 18 to be belted. Gives new meaning to “Live Free or Die.”
- Next or same-day delivery: Amazon has been redefining the retail experience for decades. Their advances include the launch of Prime in 2005 (at that point free two-day shipping). Select cities had access to same-day delivery for many items in 2009. In 2019, AMZN rolled out one-day shipping for Prime members on more than 10 million products. Today, there are lots of things that can be delivered on the same day!
- How we connect/meet/date: For many decades (millennia probably), couples met through friends, family, work, or social engagements. The ratio was stable whereby roughly 70% of couples were introduced that way…. until more recently. Online connections went from ~5% for couples in the early 2000s to more than 60% last year.
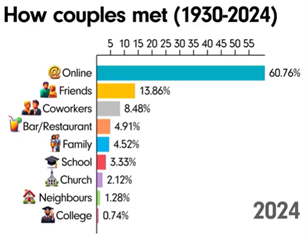
Source: Data is Beautiful, Rueben, Thomas, and Hausen.
- Trading Commissions: Not that long ago, you might pay $100 or more for a “round turn” commission on an equity or derivatives transaction. Those fees compressed as technology improved. Then, online brokerage firms pushed the envelope further. Robinhood went a step further and eliminated commissions in 2019. Shortly thereafter, Charles Schwab, TD Ameritrade, and eTrade followed suit. Now it’s effectively industry standard.
Rethinking Volatility
We’re regularly reminded of the fact that change is a constant. Whether it’s the physical world around us, capital markets, or the digital environment, they are always evolving. Let’s first look at the change in the United States’ two large cap indexes.
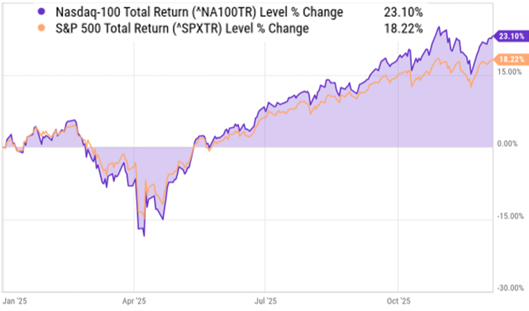
Source: YCharts
As of early December, the Nasdaq-100 Index® (NDX®) is outpacing the S&P 500® by ~500 basis points year-to-date. To be fair, on lows in April, NDX was underperforming the S&Ps by 350 basis points.
Quantitatively, that’s unsurprising. It’s a feature of the index, not a bug. NDX has a beta, or volatility relative to the broad market, that vacillates between 1.15 and 1.25. In other words, over longer time horizons, the NDX has been between 15% and 25% more volatile than the S&Ps.
Markets moving higher tend to be beneficial to assets tracking the NDX. Here’s what that looks like over a 10-year time horizon:
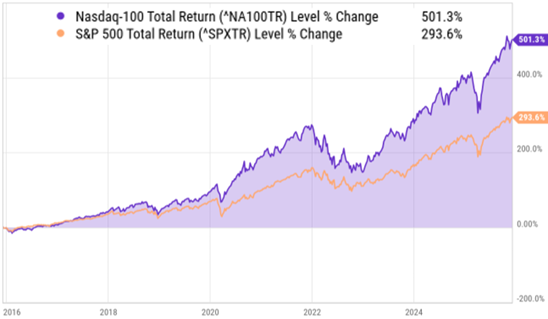
Source: YCharts
If we translate the percentage returns into dollars, the potential “value” of volatility becomes quite clear.
- $10,000 one-time investment in an NDX-tracking vehicle in late 2025 is worth more than $60k today.*
- By contrast, a $10,000 one-time investment in an S&P 500 tracking vehicle at the same point in time is worth slightly less than $40k.
Investors are increasingly seeing the potential long-term value of something a little more than “vanilla” equity exposure. Driving the point home – it’s a difference of ~$20k on a $10k investment.
Rethinking Innovation
Now (re)consider some of the life changing innovations highlighted at the outset. Seatbelts are literally life savers. Amazon and Facebook (now Meta) have had a profound impact on the global consumer. AMZN altered our expectations for shopping. META (including Instagram) shifted how and with whom we connect.
These are the types of companies that have listed on the Nasdaq stock market. In many cases, they became part of the NDX before they were S&P 500 constituents.
For example, Amazon was added to the NDX nearly 27 years ago (12/21/1998). AMZN entered the S&P in late 2005. META (then Facebook) joined NDX in December of 2012 with a market cap of around $60 billion. FB (at the time) was added to the S&P a year later when market cap more than doubled to ~$135 billion.
Tesla is another example of NDX leadership. The electric vehicle pioneer joined the ranks of the 100 largest (non-financial) Nasdaq-listed companies in July of 2013. At that point, the company was worth about $13 billion. TSLA was added to the S&P more than seven years later at a market cap of about $615 billion.
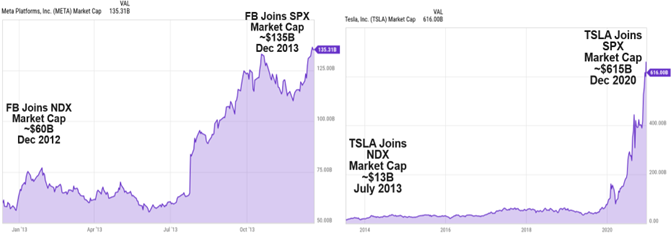
Source: YCharts
In that example, NDX captured about $600 billion in market cap growth in one company that the S&P 500 did not.
What Do You Expect?
In the coming weeks, major equity indexes will go through their annual reconstitution. If you’re interested in learning more about NDX methodology and the specifics for inclusion, there’s plenty of resources.
Ultimately, the index will shed a handful of underperforming securities and add others. The reconstitution announcement occurs after the close of business on Friday (December 12). The newly reconstituted index will begin trading on December 22 (first business day following standard December options expiration).
My expectation is that the NDX will continue to be slightly more volatile than the other large cap benchmark. As an avid option trader, I view that as a potential benefit because NDX options will almost always price on a higher implied volatility than the alternative. If my strategy is predicated on movement, I believe it will be more pronounced in the NDX. On the flip side, if I’m positioning for range-bound behavior, I would expect to take in a slightly greater premium (all else equal) by utilizing NDX index options.
Longer term, my expectation is that the future will look something like the past. In this case, history shows us that the NDX has generally outperformed the S&P 500 on a total return basis. If we go back to calendar year 2007, NDX has outperformed the S&P in 14 of the last 18 years.**
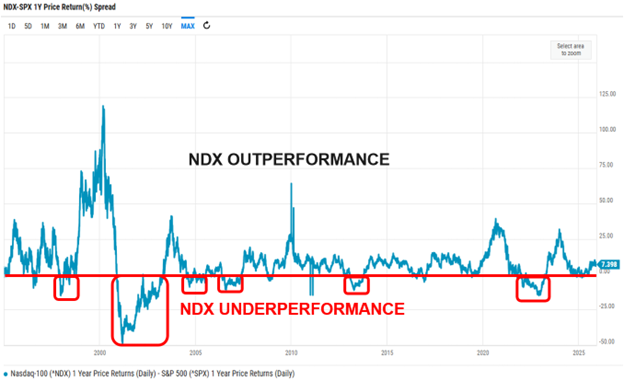
That doesn’t strike me as a short-term trend. It feels like an expectation. The visual below compares the 1-year rolling performance of NDX (price terms) to SPX. It’s a similar way to express the statistics outlined previously.
Whenever the blue line is above the red horizontal axis, NDX outperformed on a trailing 1-year basis. There have been periods of very significant outperformance during the late 1990s, early aughts, following the financial crisis, during the pandemic recovery, and after the 2022 haircut.
What does that mean for your investments?
Source: YCharts
*Not accounting for any management costs.
**Assuming no significant end of year divergence.
Latest articles

This data feed is not available at this time.
Data is currently not available