
Why are Silver Prices Soaring?
2025 was a banner year for precious metals and precious metals ETFs such as the SPDR Gold Shares ETF (GLD) and the iShares Silver Trust (SLV). In early 2024, gold broke out of a more than decade-long and frustrating consolidation. Gold bugs and gold bulls realized the power of the old Wall Street adage, “The longer the base, the higher in space.”
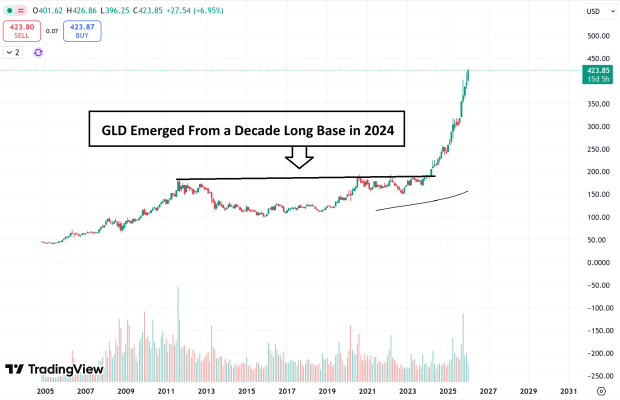
Image Source: TradingView
At the same time, silver began to rise, but its performance lagged behind gold’s. However, it wouldn’t be long before historical norms kicked in. Historically, gold breaks out first, then silver, but silver breaks out the biggest. That’s exactly what occurred in late 2025 and early 2026. Per usual, silver’s move is driven by safe-haven buying, geopolitical tensions, and inflationary concerns. Additionally, surging industrial demand from the AI, EV, and solar industries has made the current move a “perfect storm” for bulls. In fact, silver prices have more than doubled since mid-2025!
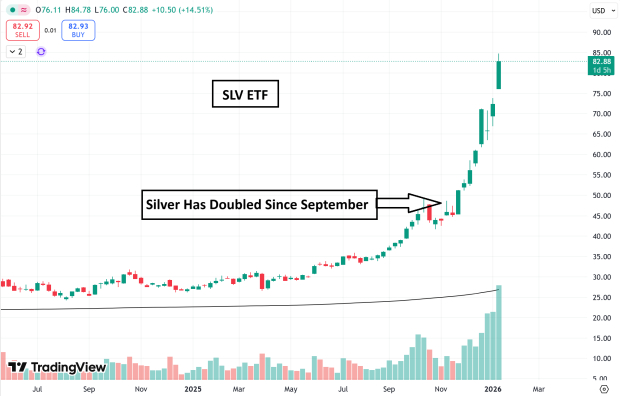
Image Source: Zacks Investment Research
Silver Has a History of Euphoric Spikes and Subsequent Busts
Knowing an asset’s history and “personality” can be invaluable to investors. For instance, natural gas is known as the “widow maker” for its tendency to have large spikes followed by large drawdowns. Silver has a similar history. Below are two of the biggest examples.
1. The Hunt Brothers Corner the Silver Market: In the late 1970s, the Hunt brothers, a group of three siblings who amassed a massive fortune from their family’s oil business, attempted to corner thesilver market When the Hunts began buying silver, it traded at $4/oz, but by 1980, it soared to $50. However, things took an ugly turn when regulators began tightening rules to address market manipulation. By March 1980, silver would fall all the way back to ~$10/oz.
2. 2000s Commodity Bull Market: Silver prices began to soar again in the early 2000s, driven by China’s industrialization. Later, the bull market would accelerate dramatically as the 2008 Global Financial Crisis would drive investors to seek refuge in silver. In 2011, silver prices would peak at $48/oz. By 2013, prices would be cut in half.

Image Source: TradingView
Is Silver Forming a Classic Blow-Off Top?
Silver prices have doubled in a handful of months, rewarding bulls. However, signs are emerging that the rally may be long in the tooth, and history may soon repeat itself. These signs include:
· SLV ETF Records Record Volume: Excessive trading volume is a hallmark of a blow-off top.On Wednesday, the SLV ETF traded a record $14.3 billion in trading volume.

Image Source: @subutrade
· Silver Price is Stretched: Investors can gauge how extended an asset is by gauging the distance from the 200-day moving average. In 2011, silver topped when it was ~84% above the 200-day MA. Currently, silver is over 100% above its 200-day MA.
· Limits on Silver Sales: In yet another sign of frenzy, retail giant Costco (COST) is limiting silver bar sales to one per customer.
Markets Can Stay Irrational
Although yellow flags for silver’s raging uptrend are appearing, this does NOT necessarily make it a short at these levels. As the old Wall Street adage warns, “Markets can stay irrational longer than you can remain solvent.” Additionally, silver has a history of “overshooting” in both directions.
Bottom Line
Silver prices have more than doubled since mid-2025, driven by a combination of safe-haven buying and surging industrial demand. However, yellow flags are appearing in silver’s uptrend, including record trading volume and a stretched chart.
Zacks Names #1 Semiconductor Stock
This under-the-radar company specializes in semiconductor products that titans like NVIDIA don't build. It's uniquely positioned to take advantage of the next growth stage of this market. And it's just beginning to enter the spotlight, which is exactly where you want to be.
With strong earnings growth and an expanding customer base, it's positioned to feed the rampant demand for Artificial Intelligence, Machine Learning, and Internet of Things. Global semiconductor manufacturing is projected to explode from $452 billion in 2021 to $971 billion by 2028.
See This Stock Now for Free >>Costco Wholesale Corporation (COST) : Free Stock Analysis Report
SPDR Gold Shares (GLD): ETF Research Reports
iShares Silver Trust (SLV): ETF Research Reports
This article originally published on Zacks Investment Research (zacks.com).
The views and opinions expressed herein are the views and opinions of the author and do not necessarily reflect those of Nasdaq, Inc.

