

The Intermediate Place
The theory of purgatory (celestial Hades) has existed for millennia. Plato opined about an “intermediate place between earth and heaven” in roughly 400 BC. That idea didn’t broadly take root for approximately 15 centuries until the Catholic Church convened the Second Council of Lyon.
I’m reminded of both the relative view of time and the idea of purgatory (as well as my Catholic school-based upbringing) when thinking about the broad market and index options this week. The prevailing market “vibes” strikes me like “an intermediate place” between what was and what will be.
The largest market cap stock in the world reports Q4 earnings this week. Until then, the market sits in purgatory.
An Inflection?
Nasdaq-100 Index® Options (NDX®) are rich in information and can be used to express a view about the probability of distinct outcomes.
We have some unique dynamics at play in NDX, of which Nvidia (NVDA) makes up roughly 9%. There are also some broader similarities to the same point in the calendar just a year ago. In advance of NVDA’s numbers, the options market is pricing the narrowest ”earnings straddle” for the AI infrastructure leader in many years. Let’s investigate.
NDX Volatility: What the Numbers Are Hiding
NDX feels volatile, but the numbers say otherwise. Year-to-date, the index moved with an annualized volatility of just 16.03%. For some perspective, the long-term average annual volatility for NDX is ~21%.
If the index continued to move with this (lack of) velocity, it would be the lowest vol year since 2013. In other words, in the first seven+ weeks of 2026, the market is moving less than it did in 2016 (16.2% vol) or 2019 (16.4% vol).
Digging a bit deeper, the average (absolute value) close-over-close move in NDX is just 80 basis points. Last year, the same measure was 96 basis points, or just less than 1% per day.
Some readers watch the markets more closely, and likely position using index options. I’m one of you, and this doesn’t “feel” like a low vol market. In fact, if you evaluate the spot market’s average intraday ranges, they are in line with last year’s typical range: +/-1.46%. When you incorporate the futures market (overnight hours) the swings have been even more significant.
In brief, NDX intraday volatility has been ”normal” to slightly elevated when considering overnight sessions. However, the close-over-close moves are more in line with a ”low vol” market. This gap between perceived and measured volatility may create opportunities for NDX options users, depending on your exposure and time horizon.
Late February, Again: Year Over Year Parallels in NDX Options
Last year in late February, NDX was coiling around the 21.5k level with realized volatility and index skew measures creeping higher into NVDA’s quarterly report. This year, there are similar dynamics in play. The index has been chopping on either side of 25k for months and 90-day NDX skew is on the rise.
Let’s look at the 3-month NDX options on a year-over-year (Y/Y) basis just before NVDA’s Q4 (late February) report.

Source: Bloomberg
The shape of the 3-month NDX volatility curve looks remarkably similar to late February 2025. The key difference: implied volatility is uniformly higher in 2026, with the largest increases concentrated in OTM puts.
Translation: Demand for downside protection has grown disproportionately. Very similar shifts have occurred in derivative markets across major indexes in 2026.
However, there are important differences in index construction. For example, NVDA’s weight within NDX is ~9%. By comparison, NVDA makes up ~7.7% of the S&P 500. Keep in mind that constituent weights will fluctuate through time.
This dovetails nicely with an evaluation of NDX and S&P 500 out-of-the-money (OTM) option volatility. Using tools from Pricing Monkey, we can compare the volatility spread between similar index options and potential identify opportunities.
In this case, we’re looking at the spread (IV terms) between the 3-month 25-delta puts in NDX relative to the S&P 500 over the past three years.
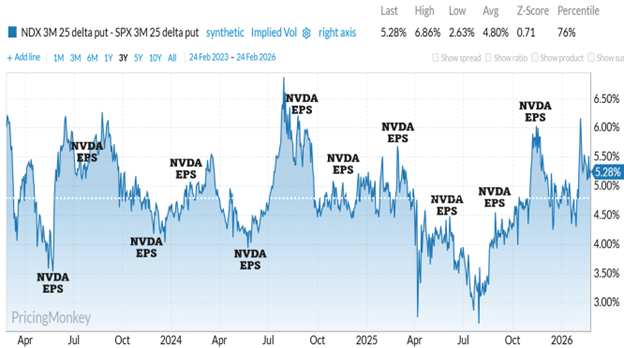
Source: Pricing Monkey
On average, NDX wing (small delta) puts trade 4.8 vol points over similar S&P options (white dotted line). On February 5, 2026, following three consecutive declines of ~1.5% (daily) for the NDX, that spread moved to the widest levels in 18 months. For those that follow along on LinkedIn, I cited the moved as it happened.
There also appears to be a tendency for NVDA’s quarterly reports to act as a catalyst for this spread. A quick glance at the visual above shows you how frequently the NVDA earnings release coincides with an inflection point for 3M relative index volatility.
For investors already managing exposure through S&P 500 options, the relative richness of NDX puts may warrant evaluating whether NDX options offer a more efficient hedge, or a spread opportunity.
NVDA's Shrinking Straddle: What It Signals
One of the most recognizable lines from Dickens’ Great Expectations includes the classic: “Ask no questions, and you’ll be told no lies.”
Unlike Pip, we have the luxury of asking questions, and the options market is obligated to answer. The information embedded in pricing is one of the most valuable signals available.
At present, NVDA options are pricing the smallest expected move for the stock in years. The Friday expiring weekly options have priced an up/down range of ~5.6%. If you isolate for Thursday’s response, the expectation is roughly +/-4.4%.
Both estimates are lower than what’s been observed over the past few years. On average, the weekly “earnings” straddle has priced +/-7.8%. If you zoom in on the event (earnings per share (EPS)) risk over just the last year, the average is +/-7.3%.

Source: Susquehanna Financial Group
Chris Murphy, the Head of Derivatives Strategy at Susquehanna, made salient points about the evolution of NVDA in recent years.
- Realized volatility around earnings has been compressed. Averaging just +/-3.9% over the past year.
- NVDA matured and analysts’ expectations have calibrated in tandem.
After the Report: Where NDX Options Go from Here
The market will likely have more clarity around AI capital expenditures, NVDA demand and margins, as well as their forecast for 2026 when this is read. Perhaps we’ll transition from the state of purgatory.
Whether that catalyzes a move higher or lower in NDX remains to be seen. There’s an opportunity to learn despite uncertainty. Continue to ask and refine your questions (perhaps with the help of an LLM).
NDX options are rich in information and can be used to express a view about the probability of distinct outcomes. The short-dated options continue to show strong growth as end users lean into the NDX’s higher realized and implied volatility levels. There’s also increased demand for longer-term portfolio risk management tools.
The economy is evolving quickly. So too are the tools at your disposal to potentially capitalize on the rate of change or insulate yourself from outcomes that would be adverse for your overall portfolio.
We'll continue to unpack these dynamics as the data evolves. NDX options remain one of the most expressive tools for navigating what comes next.
Latest articles

This data feed is not available at this time.
Data is currently not available