
The Procter & Gamble Company PG stock has regained momentum in the past month, fueled in part by its second-quarter fiscal 2026 results released on Jan. 22, 2026. Shares of the consumer products company giant have risen 10.5% in the past month, including a solid 6.4% gain since the earnings announcement, reflecting renewed investor confidence.
The stock’s 10.5% growth led it to outperform the broader Consumer Products - Staples industry and the Consumer Staples sector, which rose 9.9% and 9%, respectively, in the past month. The stock also outpaced the S&P 500 index’s 0.8% decline in the same period.
PG’s performance is also notably stronger than that of its competitors, Kimberly-Clark Corporation KMB, BJ's Wholesale Club BJ and Albertsons Companies ACI, which have rallied 9%, 4.3% and 3.1%, respectively, in the past month.
PG's 1-Month Price Performance

Image Source: Zacks Investment Research
At the current share price of $160, PG trades 16.3% above its recent 52-week low mark of $137.62. Also, the PG stock trades 11.1% below its 52-week high of $179.99.
The recent momentum has led the PG stock to move above its 50 and 200-day moving averages, indicating a bullish sentiment. SMA is an essential tool in technical analysis that helps investors evaluate price trends by smoothing out short-term fluctuations. This approach provides a clearer perspective on a stock's long-term direction.
PG Stock Trades Above 50 & 200-Day Moving Averages

Image Source: Zacks Investment Research
That said, let us explore whether PG’s recent momentum is related to the company’s second-quarter fiscal 2026 performance, outlook, or some other specific factors.
Procter & Gamble’s fiscal second-quarter results were a mixed bag, as the company exceeded the Zacks Consensus Estimate for earnings per share (EPS) but fell short on revenues. PG posted year-over-year revenue growth of 1% in the fiscal second quarter, benefiting from growth across major segments, led by improved pricing and a favorable mix.
PG’s results highlight the strength of its portfolio, which spans household and personal care categories, and demonstrates its resilience in a competitive consumer environment. Broad-based growth across categories and geographies reinforces the relevance of PG’s products in daily consumer routines worldwide. This robust sales trajectory builds on several quarters of consistent growth and positions the company well for fiscal 2026.
The company anticipates delivering another strong year of organic sales growth, core EPS growth and sturdy adjusted free cash flow productivity. It expects year-over-year all-in sales growth of 1-5% for fiscal 2026, while organic sales are expected to be flat to up 4%. PG has maintained its fiscal 2026 core EPS guidance of flat to 4% growth versus fiscal 2025 core EPS of $6.83. This outlook equates to $6.83-$7.09 per share, with a mid-point estimate of $6.96, or 2% higher.
However, the company’s sales momentum did not translate into earnings growth, as elevated commodity and input costs continue to pose a meaningful headwind to Procter & Gamble’s gross margin profile. Management acknowledged ongoing pressure from raw materials, packaging, transportation and other supply-chain-related expenses, which have weighed on the cost of goods sold and limited margin expansion. In second-quarter fiscal 2026, the core gross margin declined 50 basis points (bps) year over year to 51.9%, while the reported gross margin fell 120 bps. The currency-neutral core gross margin contracted 30 bps to 52.1%.
Tariff exposure represents another significant earnings headwind for Procter & Gamble, adding another layer of uncertainty to an already inflationary cost environment. Management highlighted that trade-related costs are creating incremental pressure on sourcing, manufacturing and cross-border supply chains. This weighed on the company’s second-quarter fiscal 2026 EPS, which was flat year over year. Currency-neutral core EPS fell 2% year over year.
Given PG’s global footprint, tariffs can disrupt cost structures across multiple categories and geographies, limiting the company’s ability to fully offset the impacts through productivity alone. While selective pricing actions and supply-chain adjustments provide partial mitigation, tariffs remain largely outside management’s control and can compress margins if sustained. For fiscal 2026, management anticipates an after-tax headwind of $400 million due to increased tariff costs.
Although it reiterated its core EPS guidance, PG revised its fiscal 2026 net EPS outlook, anticipating 1-6% growth versus the prior guidance of a 3-9% rise and fiscal 2025 net EPS of $6.51.
Estimates Suggest Soft EPS Growth
The Zacks Consensus Estimate for PG’s fiscal 2026 and 2027 EPS has edged down by a penny in the past seven days, reinforcing lingering concerns around the company’s near-term earnings growth trajectory.
For fiscal 2026, the Zacks Consensus Estimate for Procter & Gamble’s sales and EPS implies 2.8% and 2.1% year-over-year growth, respectively. The consensus mark for fiscal 2027 sales and earnings indicates growth of 2.6% and 4.4% year over year, respectively.
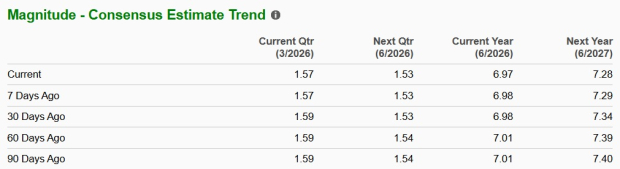
Image Source: Zacks Investment Research
PG’s Premium Valuation
Procter & Gamble undoubtedly commands a high valuation, reflecting its strong market positioning, brand power and long-term growth potential compared with its peers. However, we believe that its valuation is too stretched at this time.
PG trades at a significant premium to industry peers with a forward 12-month price-to-earnings (P/E) multiple of 22.34X. The current valuation is below its five-year high of 26.67X but higher than the broader industry’s multiple of 19.59X.
At 22.34X P/E, Procter & Gamble is trading at a valuation higher than its competitors, Kimberly-Clark, BJ's Wholesale Club and Albertsons Companies. Kimberly-Clark, BJ's Wholesale Club and Albertsons Companies have forward 12-month P/E ratios of 15.07X, 21.27X and 8.44X — all lower than Procter & Gamble.
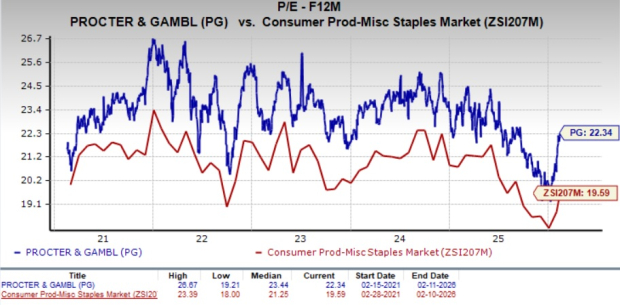
Image Source: Zacks Investment Research
How to Play PG?
The PG stock’s recent momentum reflects renewed investor optimism, supported by its resilient portfolio and steady sales growth. However, a soft EPS performance, margin pressure from higher input and tariff-related costs, and downward estimate revisions highlight near-term earnings challenges. With the stock trading at a premium valuation relative to peers despite modest growth expectations, the risk-reward profile appears stretched. Investors should remain cautious about PG’s earnings trajectory and consider staying on the sidelines, as the company’s outlook suggests limited upside at current levels. The company currently has a Zacks Rank #4 (Sell).
You can see the complete list of today’s Zacks #1 Rank (Strong Buy) stocks here.
5 Stocks Set to Double
Each was handpicked by a Zacks expert as the favorite stock to gain +100% or more in the months ahead. They include
Stock #1: A Disruptive Force with Notable Growth and Resilience
Stock #2: Bullish Signs Signaling to Buy the Dip
Stock #3: One of the Most Compelling Investments in the Market
Stock #4: Leader In a Red-Hot Industry Poised for Growth
Stock #5: Modern Omni-Channel Platform Coiled to Spring
Most of the stocks in this report are flying under Wall Street radar, which provides a great opportunity to get in on the ground floor. While not all picks can be winners, previous recommendations have soared +171%, +209% and +232%.
See Our Newest 5 Stocks Set to Double Picks >>Procter & Gamble Company (The) (PG) : Free Stock Analysis Report
Kimberly-Clark Corporation (KMB) : Free Stock Analysis Report
Albertsons Companies, Inc. (ACI) : Free Stock Analysis Report
BJ's Wholesale Club Holdings, Inc. (BJ) : Free Stock Analysis Report
This article originally published on Zacks Investment Research (zacks.com).
The views and opinions expressed herein are the views and opinions of the author and do not necessarily reflect those of Nasdaq, Inc.

